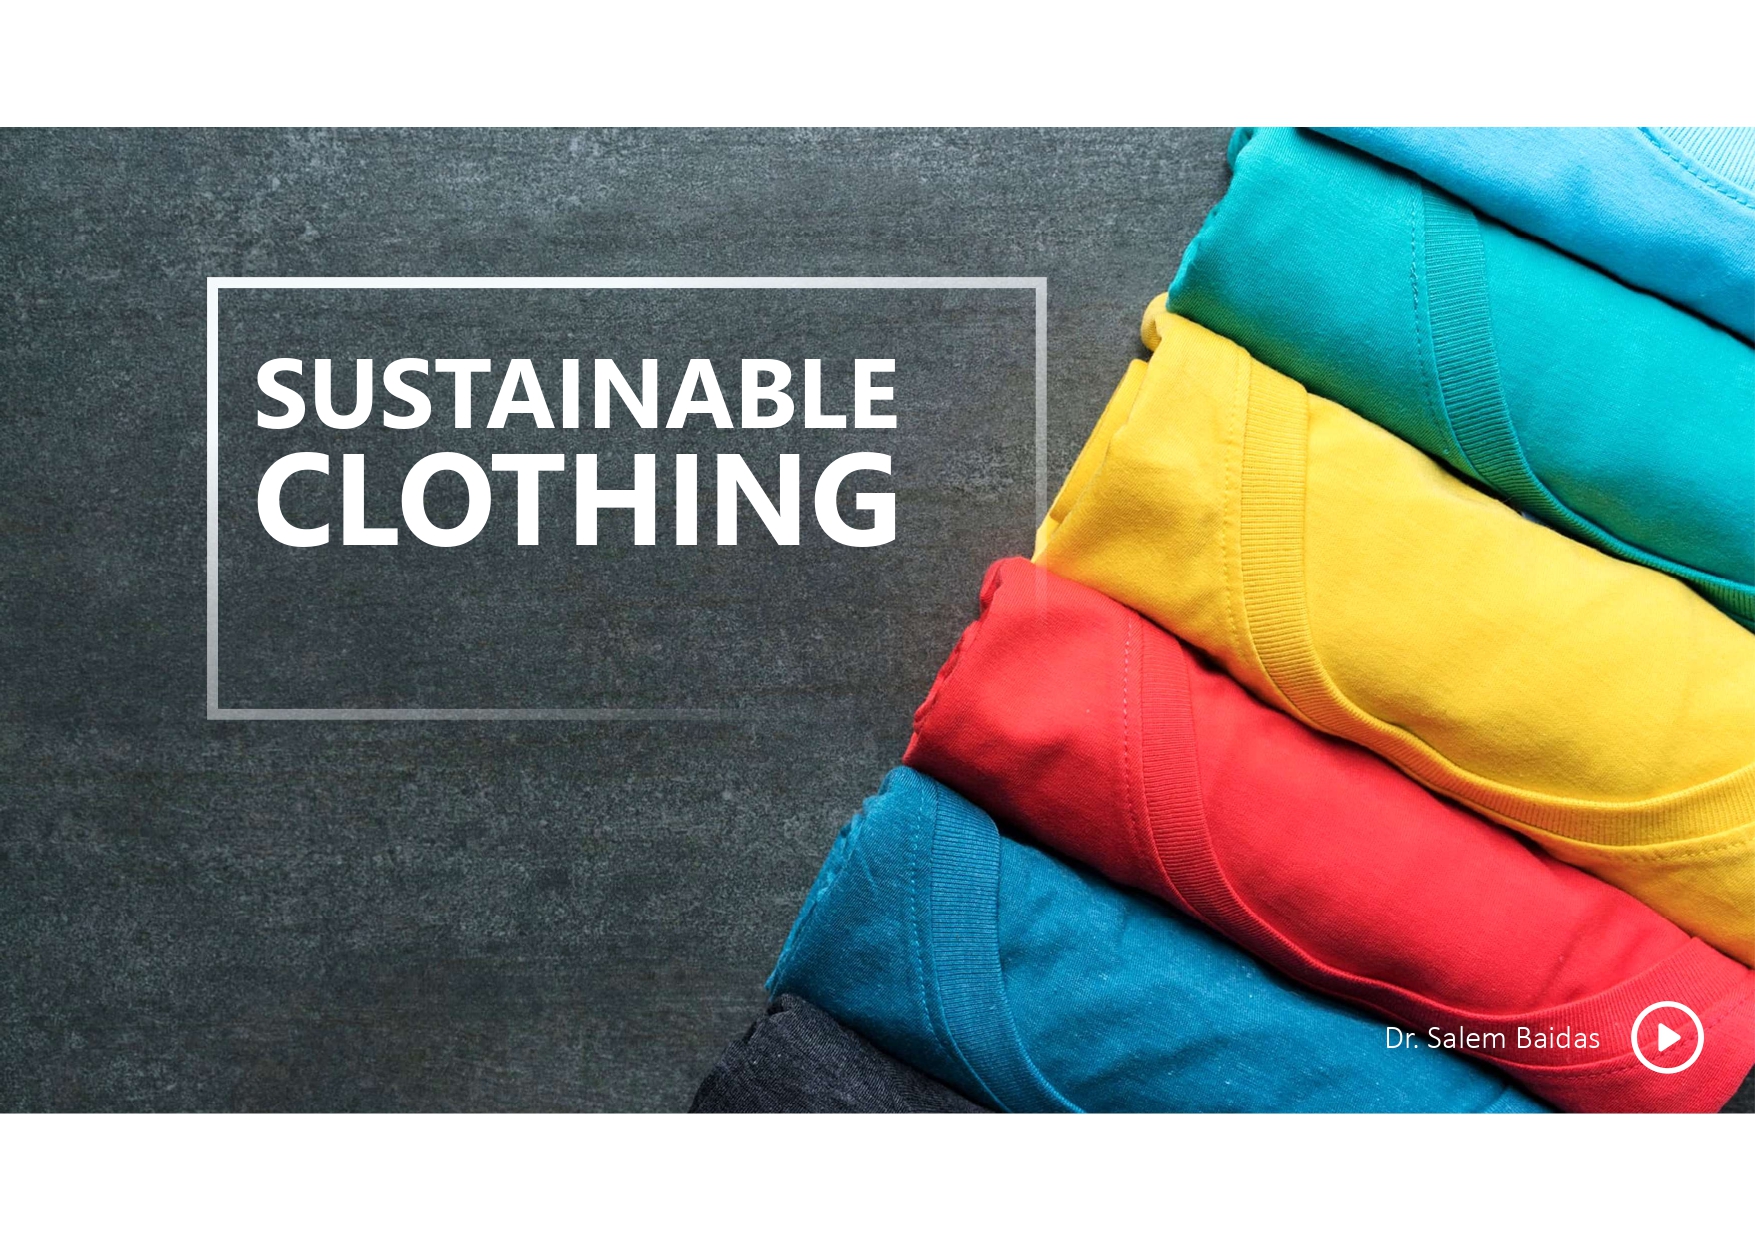
Sustainable Clothing

April 2024 – Sustainable Clothing is a type of clothing that is designed, manufactured, marketed, worn, and recycled with minimal impact on the environment such as reduced waste, carbon emissions and energy consumption. It offers many benefits, including reduced resource and energy costs, increased revenue, reduced environmental impacts, and enhanced climate change mitigation. However, there are challenges facing the sustainable clothing industry, such as the high initial cost of natural, chemical-free fabric, compatibility issues regarding special clothing requirements, lack of consumer awareness, and lack of policies and regulations. In 2018, at the Fourth United Nations environment assembly in Kenya, the UN alliance for sustainable fashion initiative was adopted to promote projects and policies that align the sustainable fashion value chain with sustainable development goals and directly supporting SDG12: Ensure sustainable consumption and production patterns.

In this slideshow, you will learn about the definition, features, benefits, advantages, challenges, solutions, UN policy, and global statistics of Sustainable Fashion.   

sustainable fashion ppt.
sustainable clothing ppt.
A close-up of a dictionary open to a page showing the word "definition" in bold blue text over the page.
sustainable fashion definition.
Illustration describing sustainable clothing features with 4rs: recycle, reuse, reduce, repair, highlighting attributes like easy recycling, minimal water use, and biodegradable fabrics.
sustainable fashion benefits.
Informative graphic detailing the environmental, cost, and social advantages of sustainable clothing, including reducing resource use, costs, and supporting worker rights.
sustainable fashion challenges,
Infographic detailing sustainable clothing solutions focused on cost savings, logistics, policies, and awareness with a dark background and blue highlights.
An image featuring the United Nations flag with the text "POLICY SUPPORT" overlaid on the left side.
sustainable clothing UN policy
A dark background with the word "Infographics" in white text on the left and a bar graph on the right showing four triangles in blue, yellow, red, and green with numbers 3.6, 6.6, 9.7, and 4.1 respectively.
Text slide titled "global clothing industry environmental impacts" on a dark grey background.
Infographic showing a projected 45% increase in global greenhouse gas emissions by the apparel industry from 2019 to 2030.
Bar chart showing the carbon footprint in thousand metric tons of co2 equivalent for leading european clothing brands, with h&m highest at 61.
Bar chart showing scope 3 emission shares of global clothing companies in 2023, categorized by type, with "others" having the highest at 34%.
Text "global clothing industry environmental initiatives" in blue and white on a dark gray background.
Bar chart showing most transparent clothing brands by transparency index score for 2023, with gucci at the top followed by ovs and kmart australia.
Bar chart showing percentages of clothing made from natural fibers by various brands in 2022, with h&m having the highest percentage at 80%.
Infographic displaying initiatives by the clothing industry in 2022 to reduce carbon footprint, including use of sustainable materials and virtual meetings.
Graph showing the carbon footprint tracking status in the clothing industry for 2022, detailing percentages of tracking efforts and knowledge.
Bar chart showing sustainability challenges in the clothing industry by mckinsey in 2022, highlighting issues like cost of standards, quality of materials, and investment impact.
Chart titled "general challenges worldwide by the clothing industry [2023]" listing challenges like environmental impacts (14%), human rights (13%), climate strategy (11%), and health & safety (4%).
Image displaying text "global clothing industry circular economy" on a dark gray background with blue and white lettering.
Bar chart showing types of circular programs by clothing companies in 2022 with their percentages, ranging from recycling to sustainability education.
Bar chart showing circular commitments by clothing companies worldwide in 2022, with strategies for increasing the use of recycled materials and collecting used products.
Graphical data showing global clothing circular metrics in 2022: recycled post-consumer fibers at 13%, repaired and resold products at 9%, total production at 7%.
Bar chart showing revenue of leading circular clothing companies in million dollars for 2020-21, with total at the highest (1600 million).
Bar graph showing used clothing imports in millions of dollars for 2022, with pakistan leading, followed by india, chile, uae, and the u.s.
Bar graph showing the leading exporters of used clothing in 2022 in million dollars, with china as the top exporter.
Text on a gray background reading "global clothing industry consumer view" in white and blue letters.
Bar chart showing chanel as the top sustainable luxury brand at 48%, followed by hermès and dior at 43%, with prada at the lowest at 35% in 2022.
Infographic showing 60% rate sustainability important, 30% neutral, 10% not important for purchasing from a brand in 2019, cited to simon-kucher.com.
Bar chart showing the percentage of consumers buying less clothing for sustainability in 2023: france (71%), germany (66%), uk (65%), and u.s. (60%). source: stifel.com.
Text "global clothing industry market value" displayed in bold white and blue letters on a dark grey background.
Bar chart showing the global market value of the clothing industry from 2018 to 2028, with a projected 30% growth, data sourced from statista.
Bar chart showing the increasing global market share of sustainable clothing from 2013 to 2023, indicated by percentages on the y-axis and years on the x-axis.
Bar chart depicting the ethical clothing global market value from 2022 to 2027, forecasting 50% growth, with values rising from $7.55 billion to $11.12 billion.
Graph showing the growth of the used clothing global market value from 2021 to 2027, indicating a threefold increase by 2024.
THANK YOU" text on a background of orange, geometric, folded paper with credit given to Dr. Salem Baidas.
A logo featuring a blue lightning bolt symbol next to the text "S2ADesign.com" in white, set against a dark gray background.
error: Content is protected !!