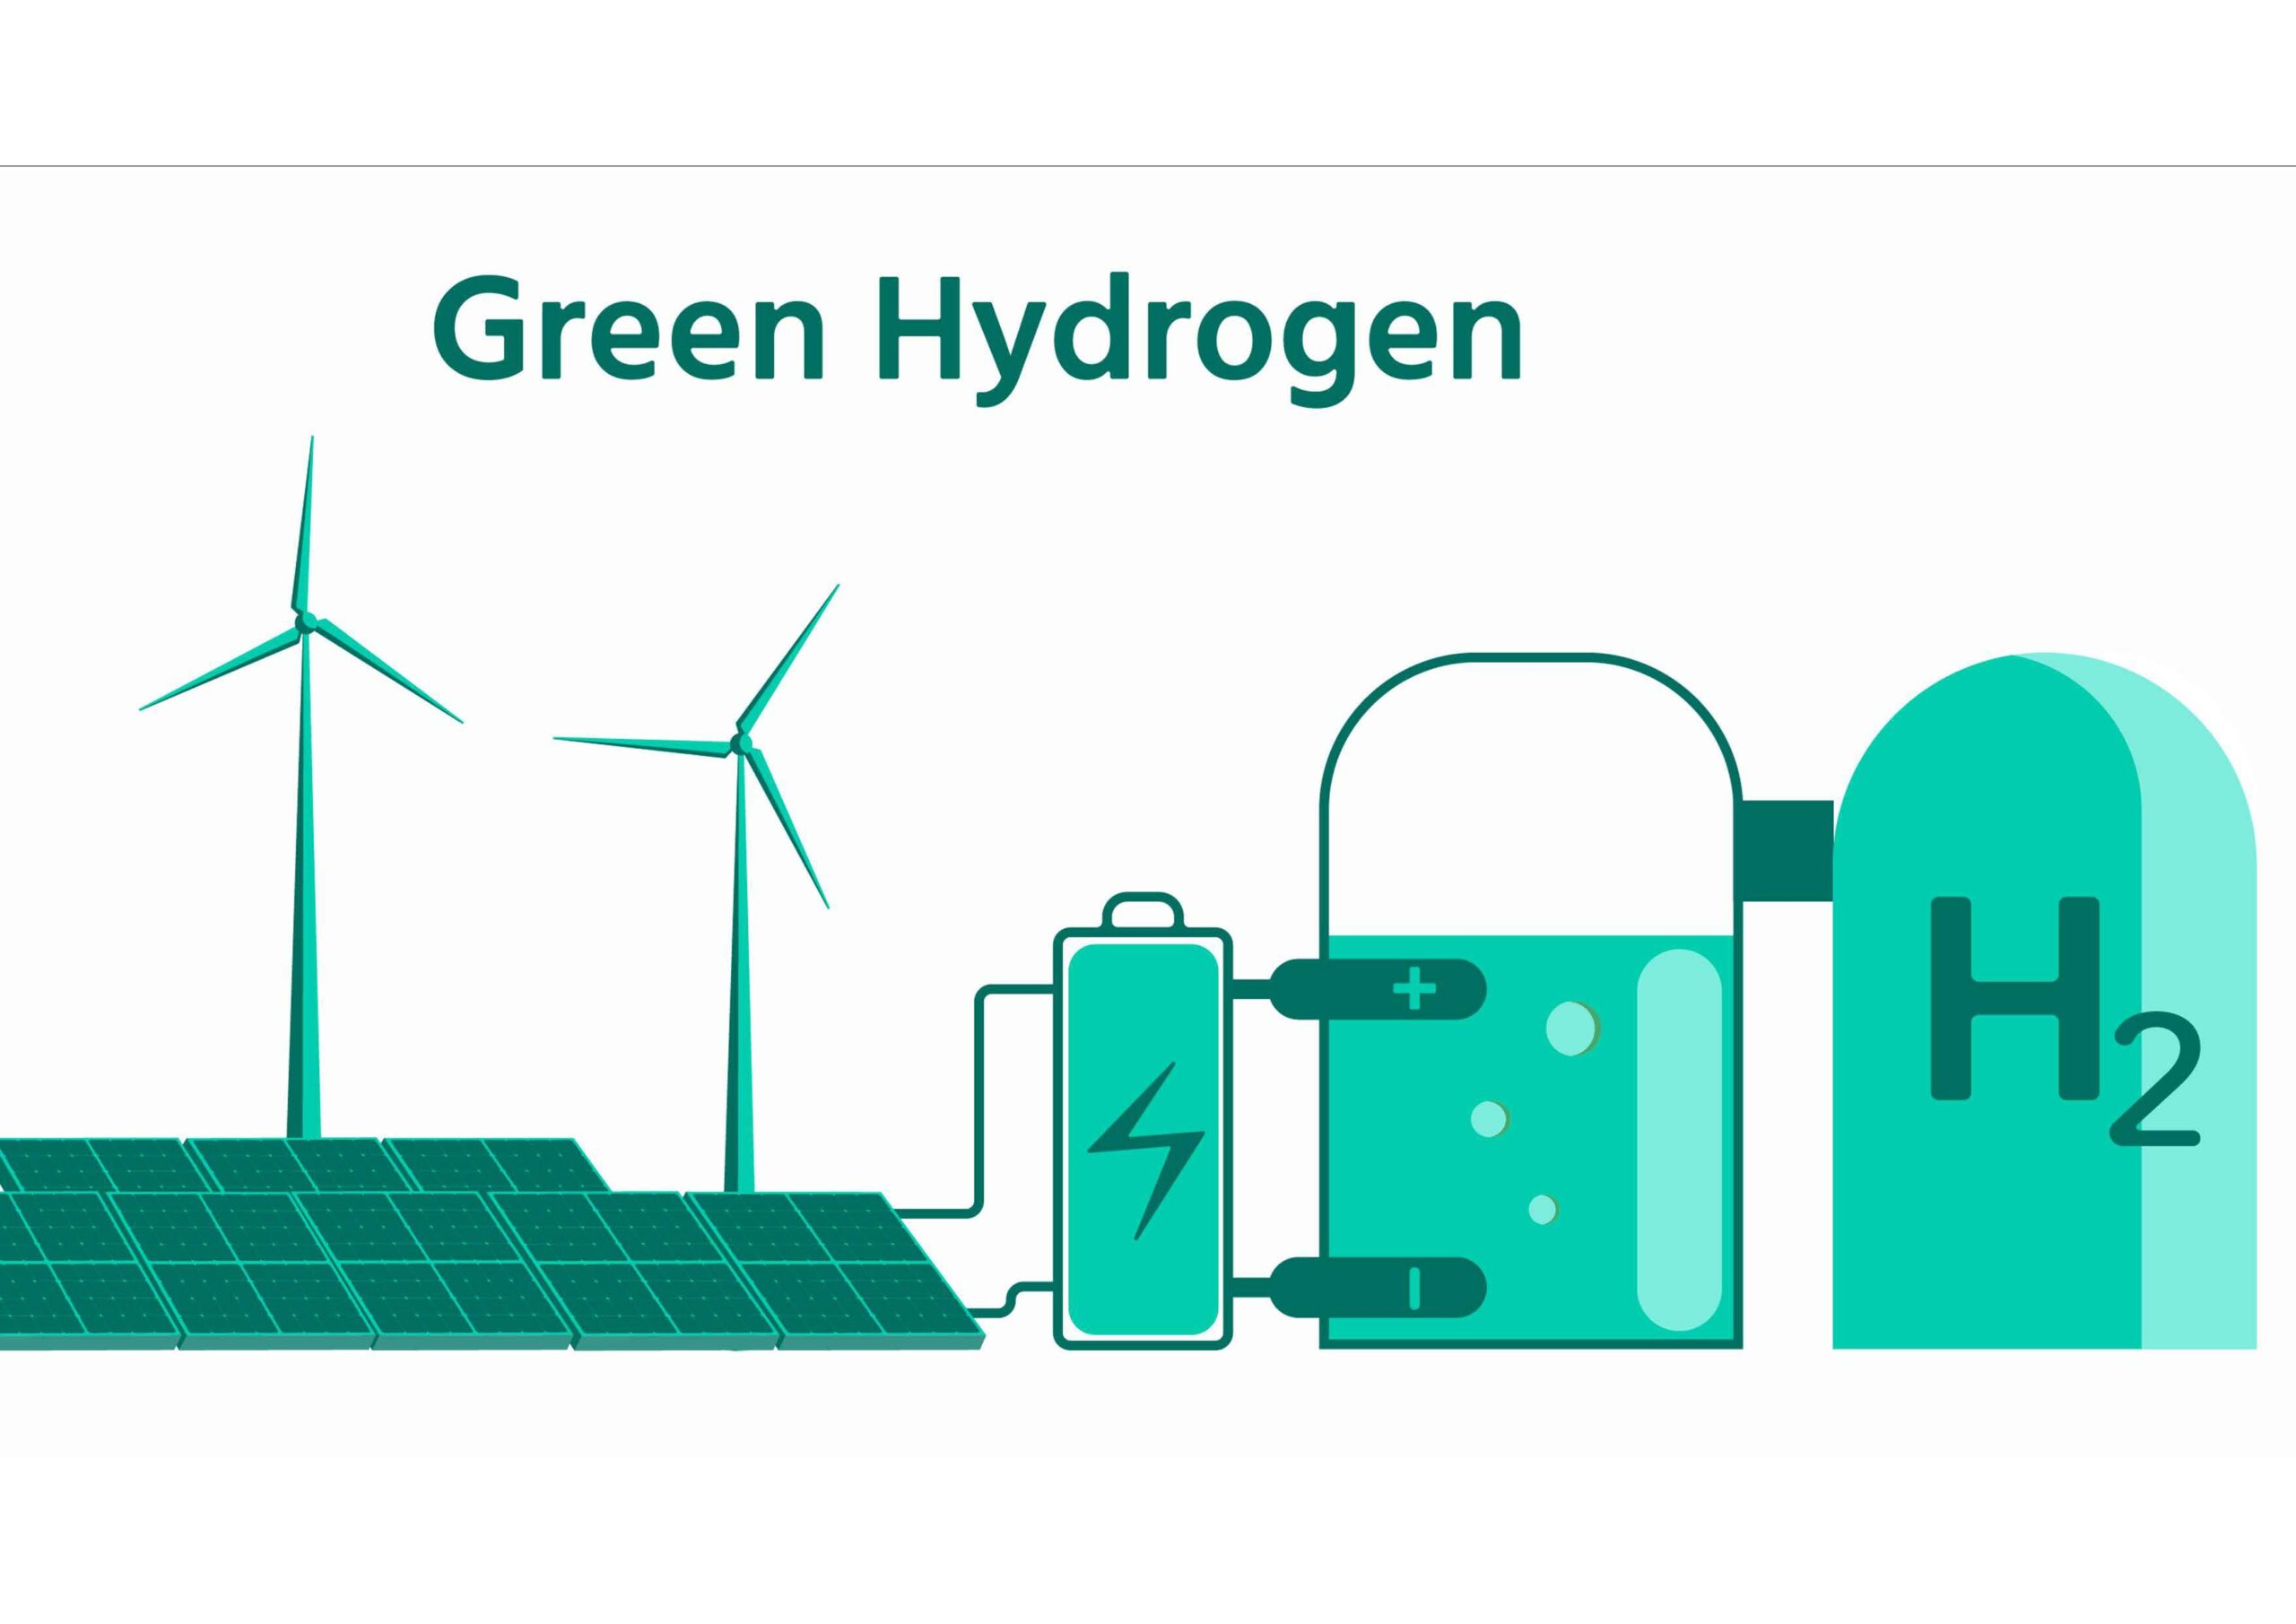
Green Hydrogen

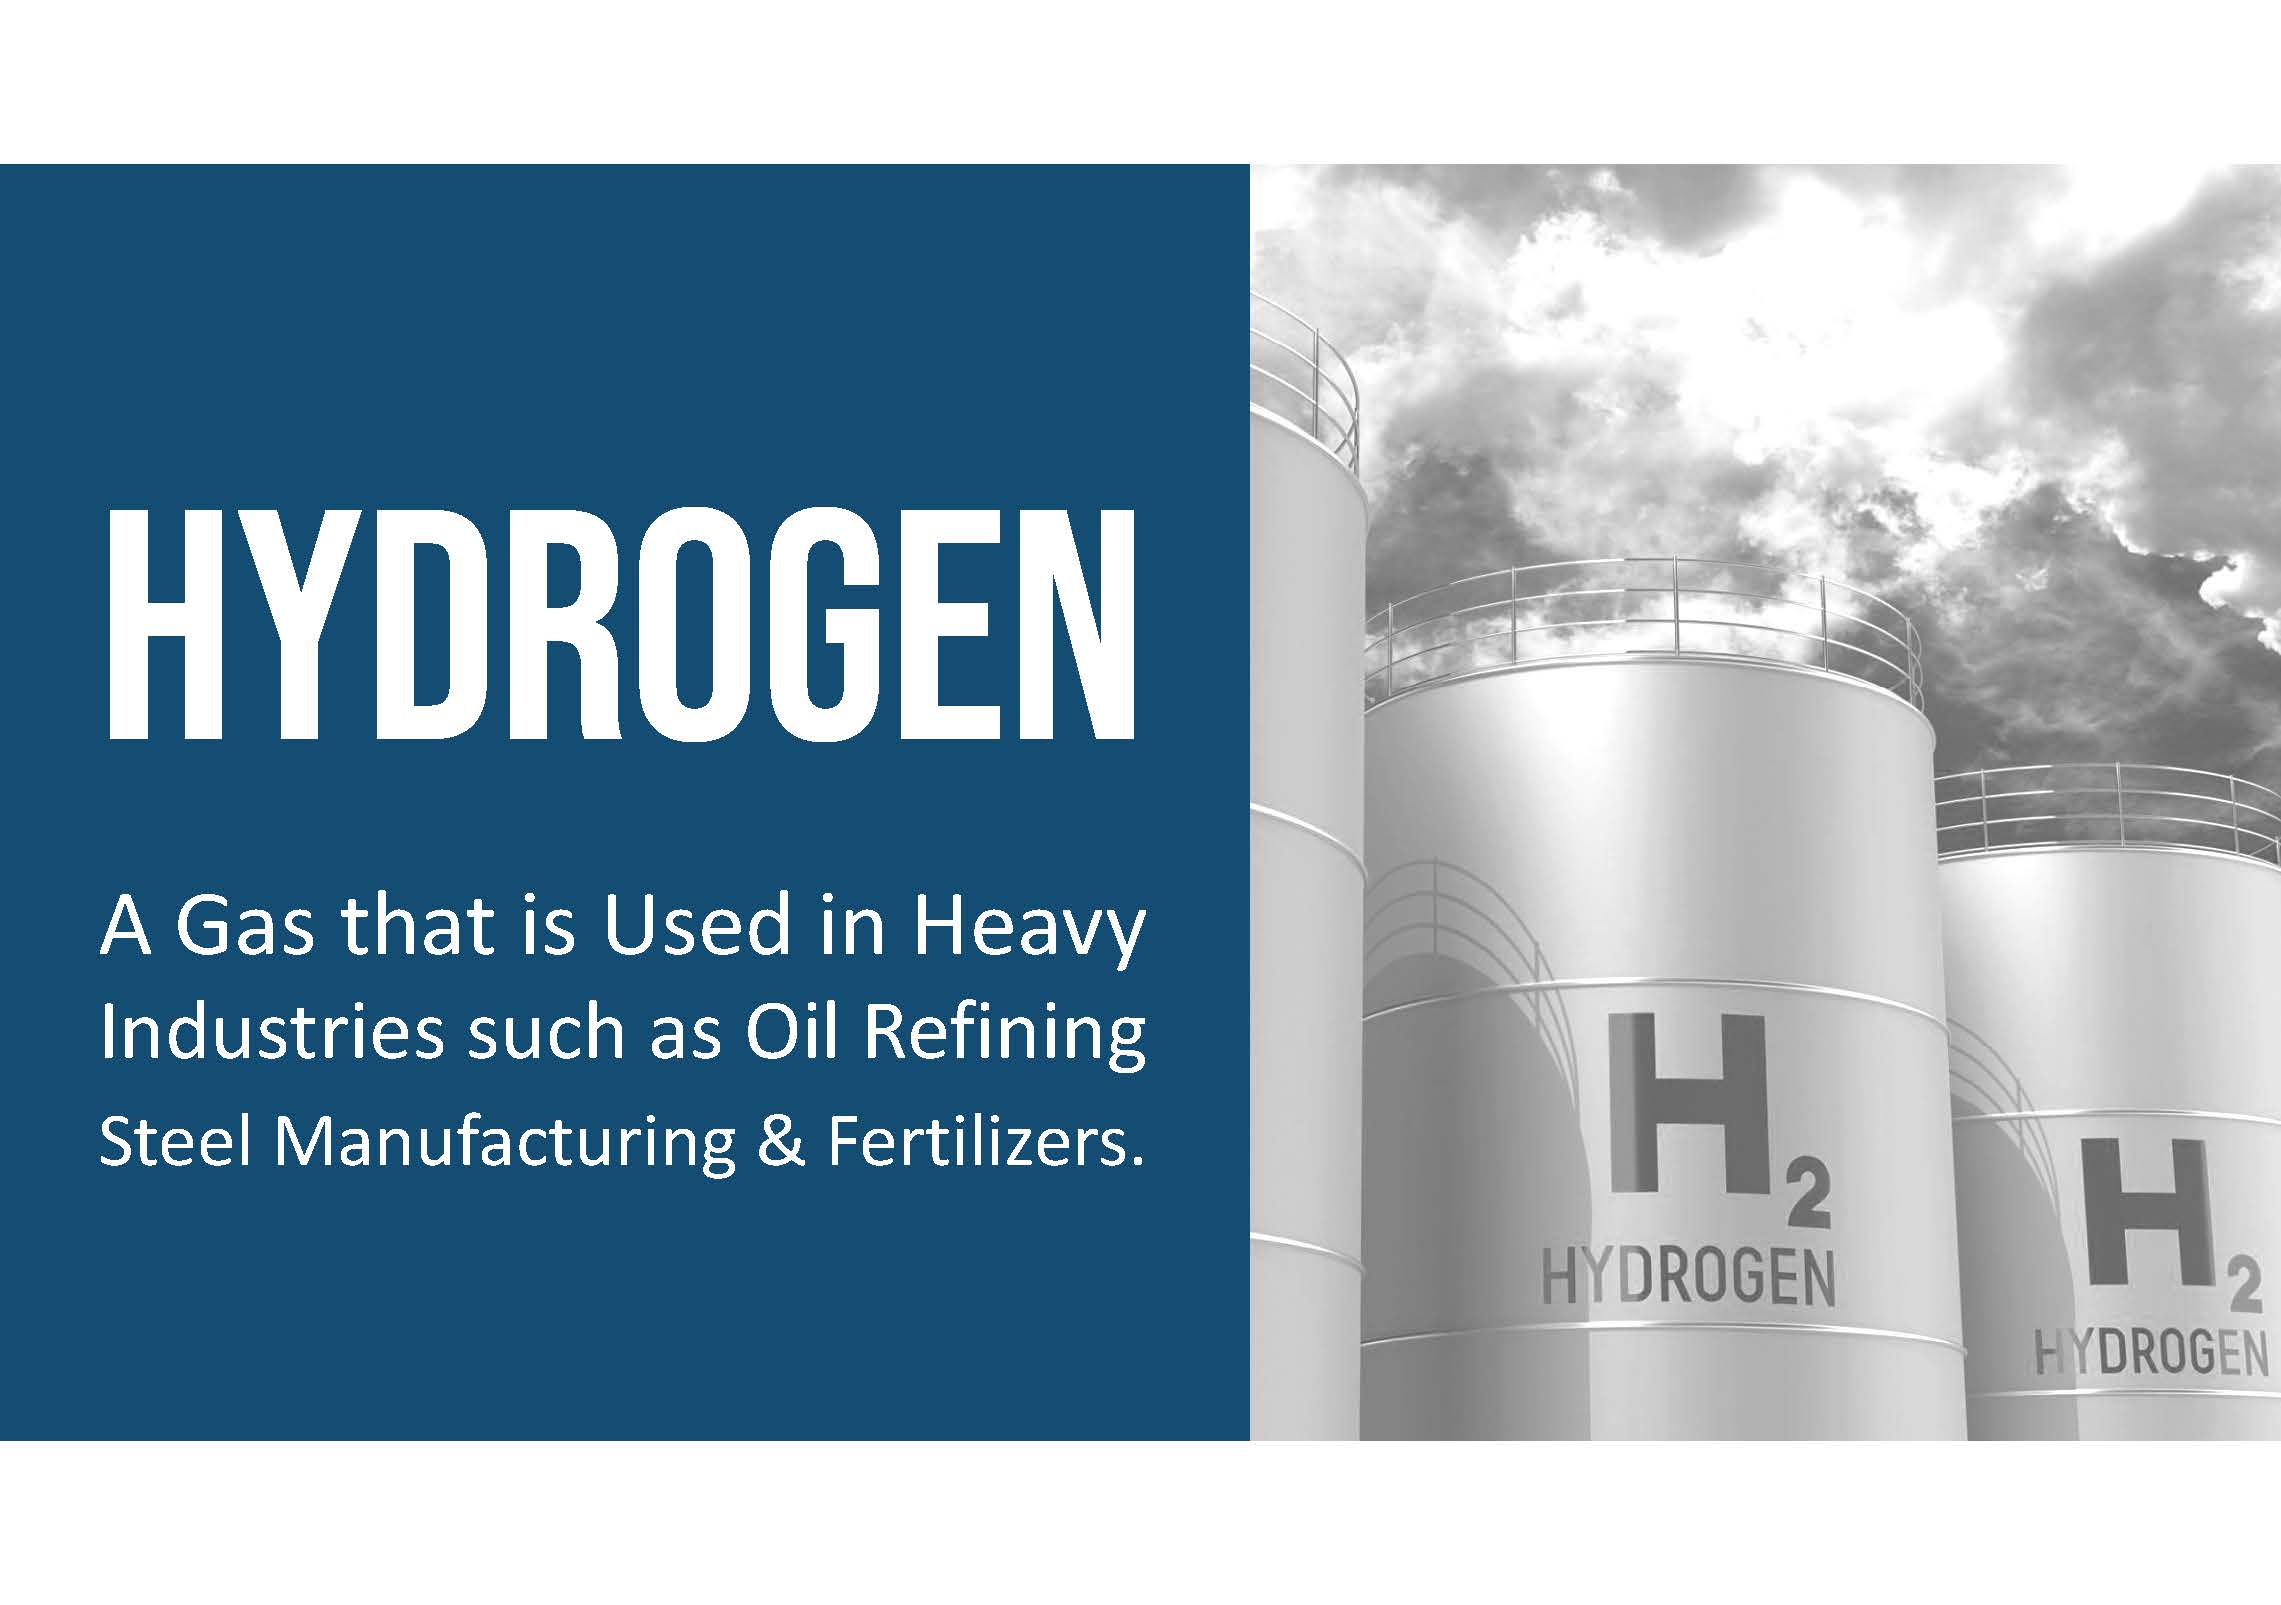
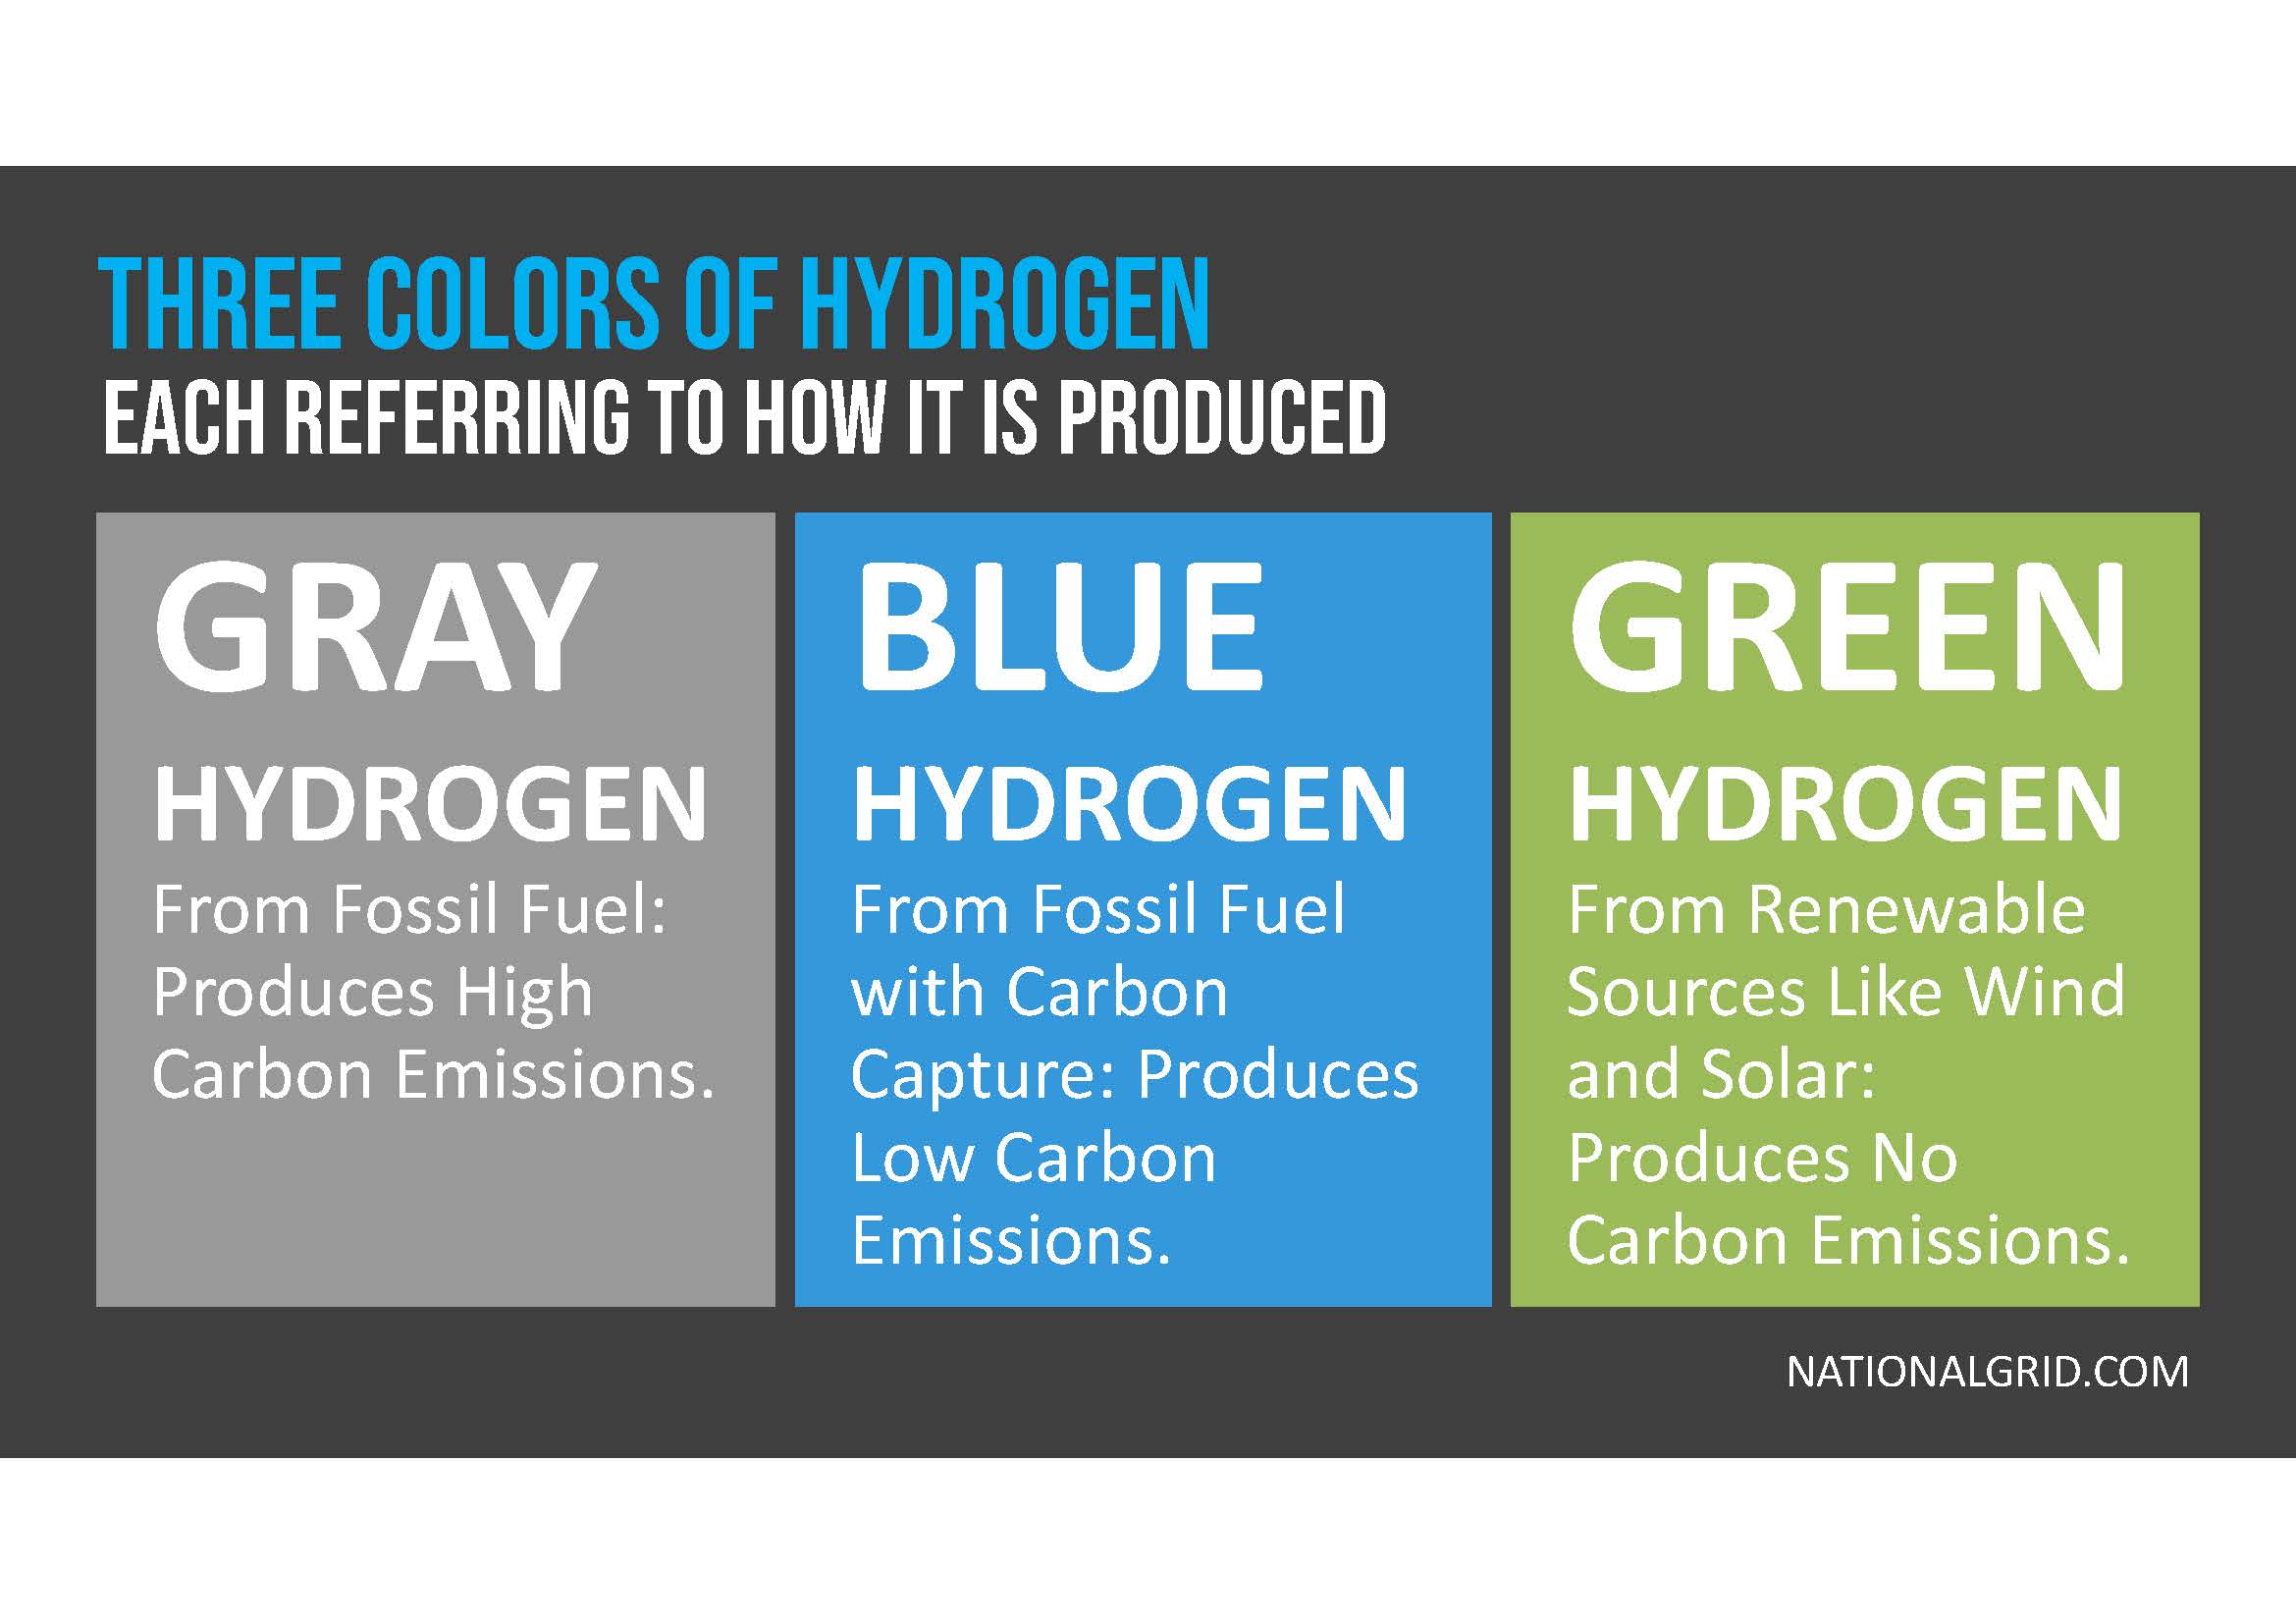
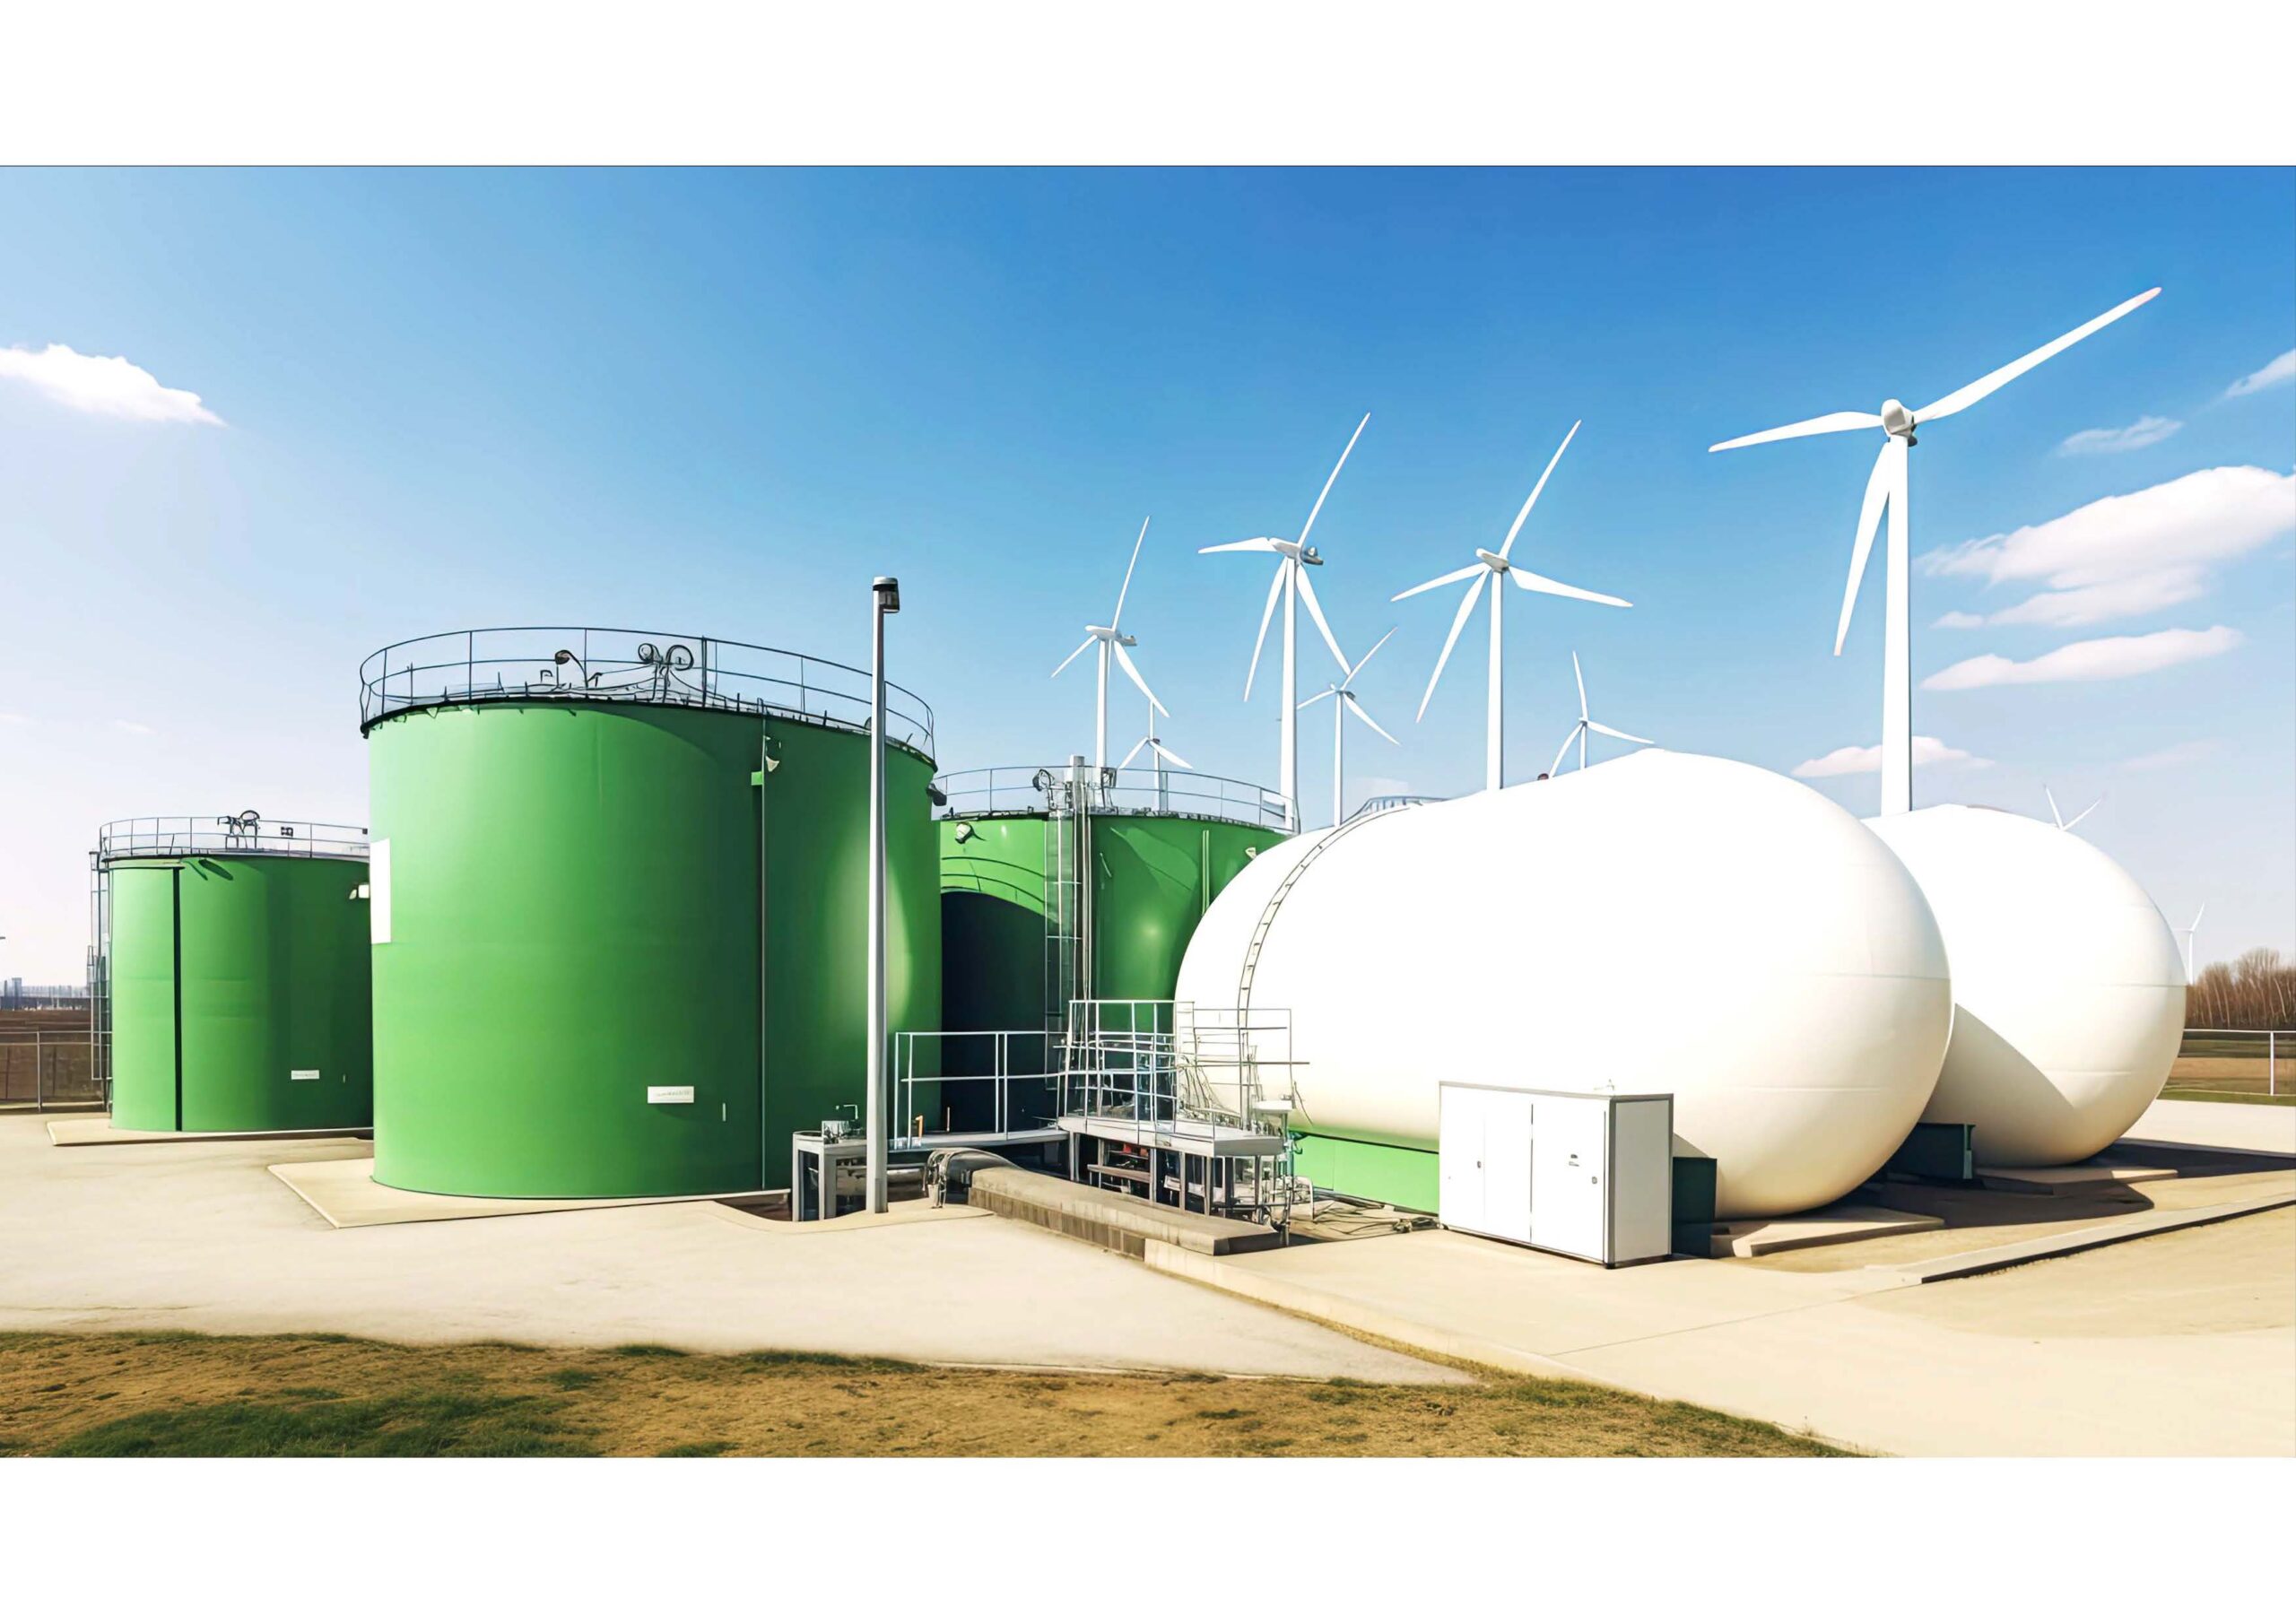
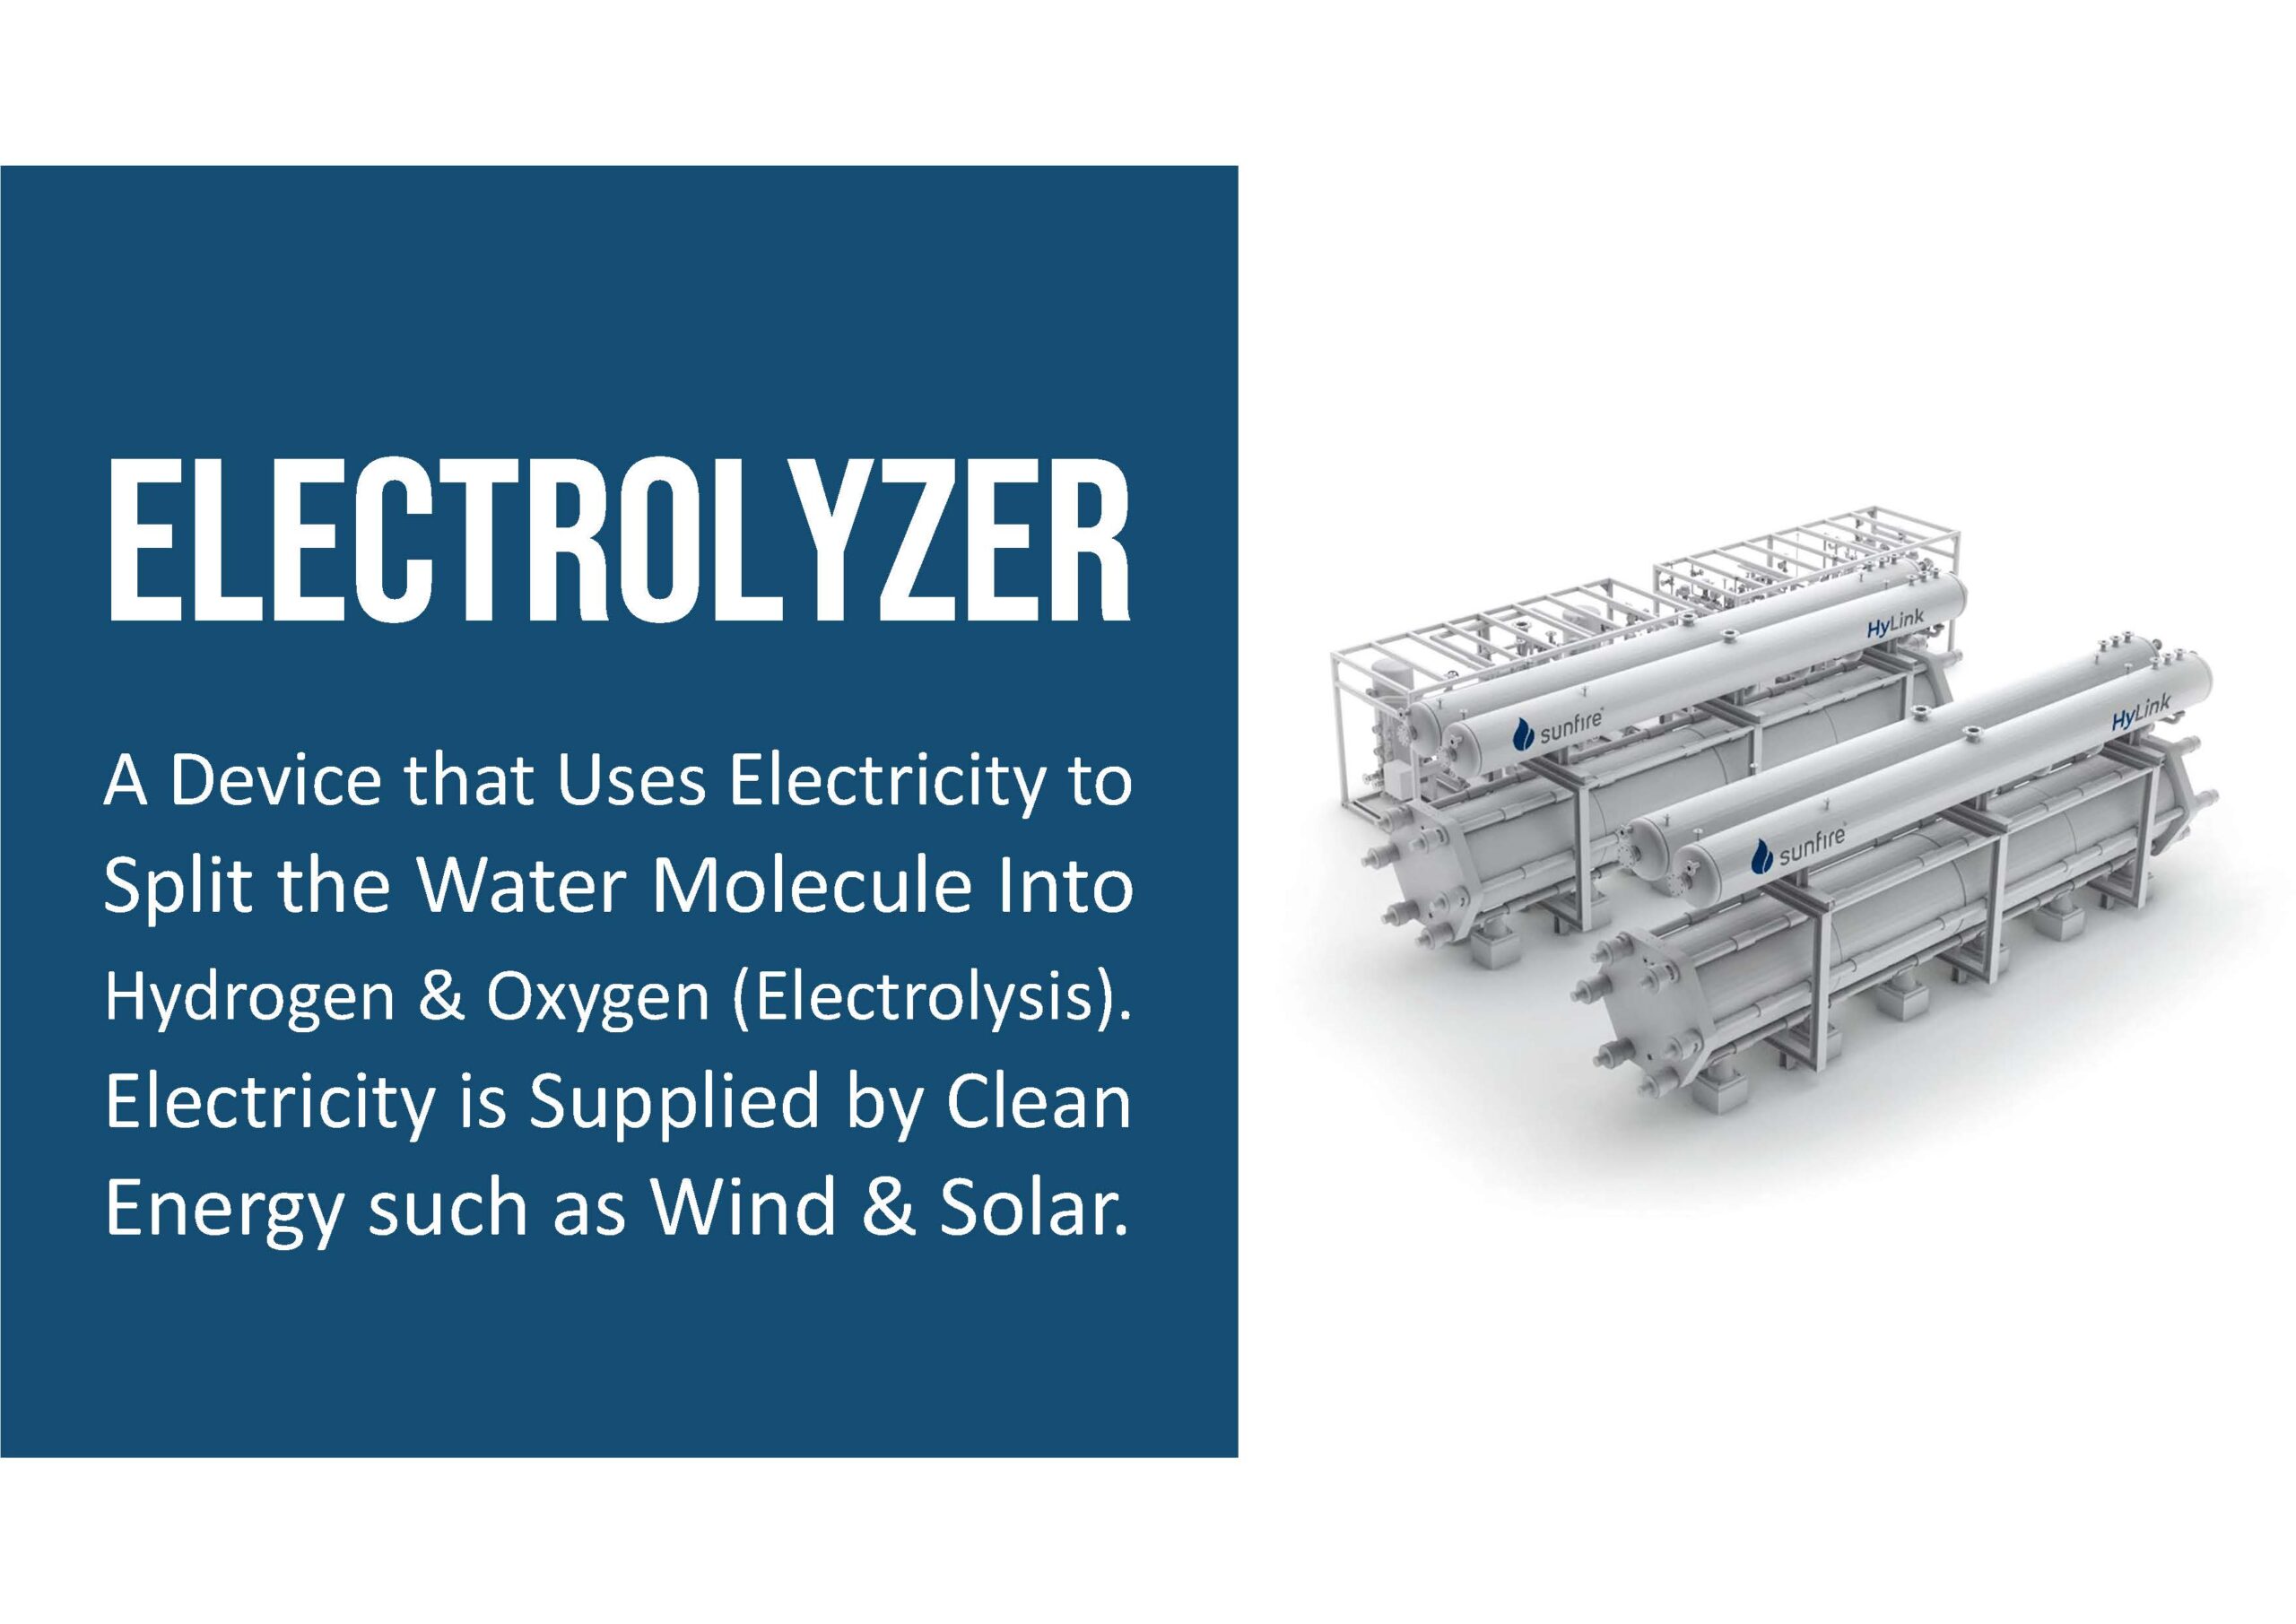
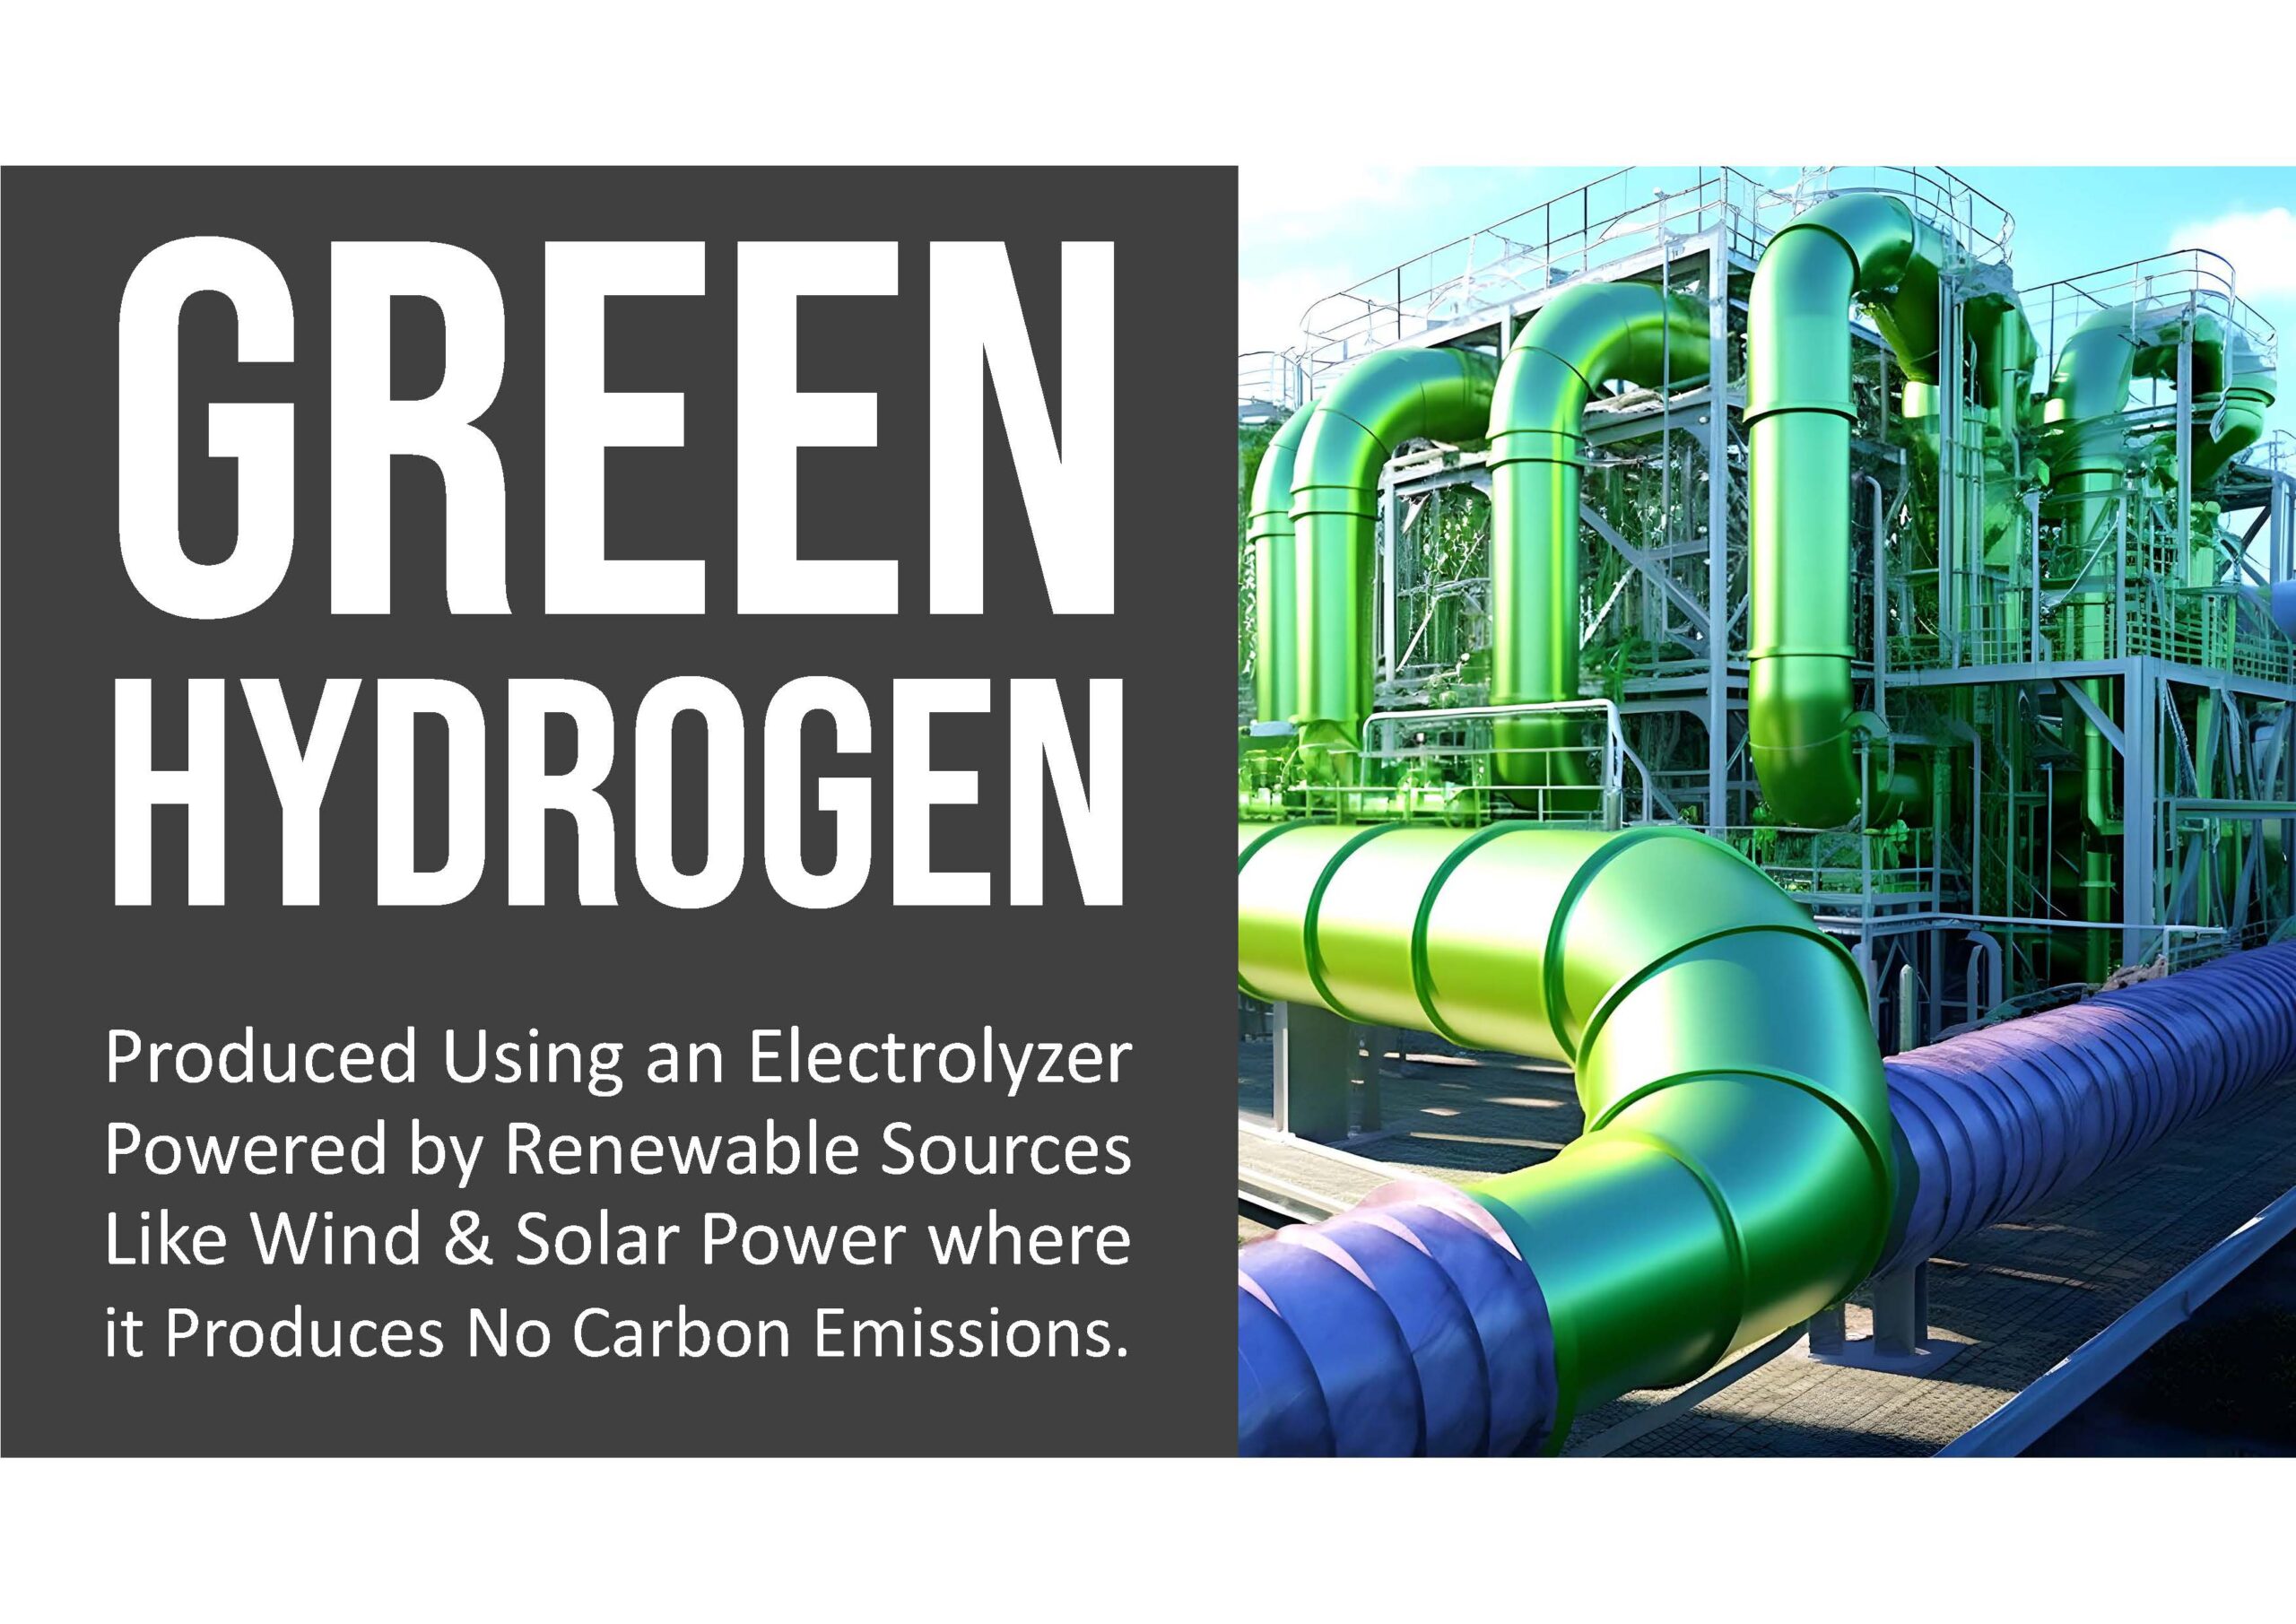
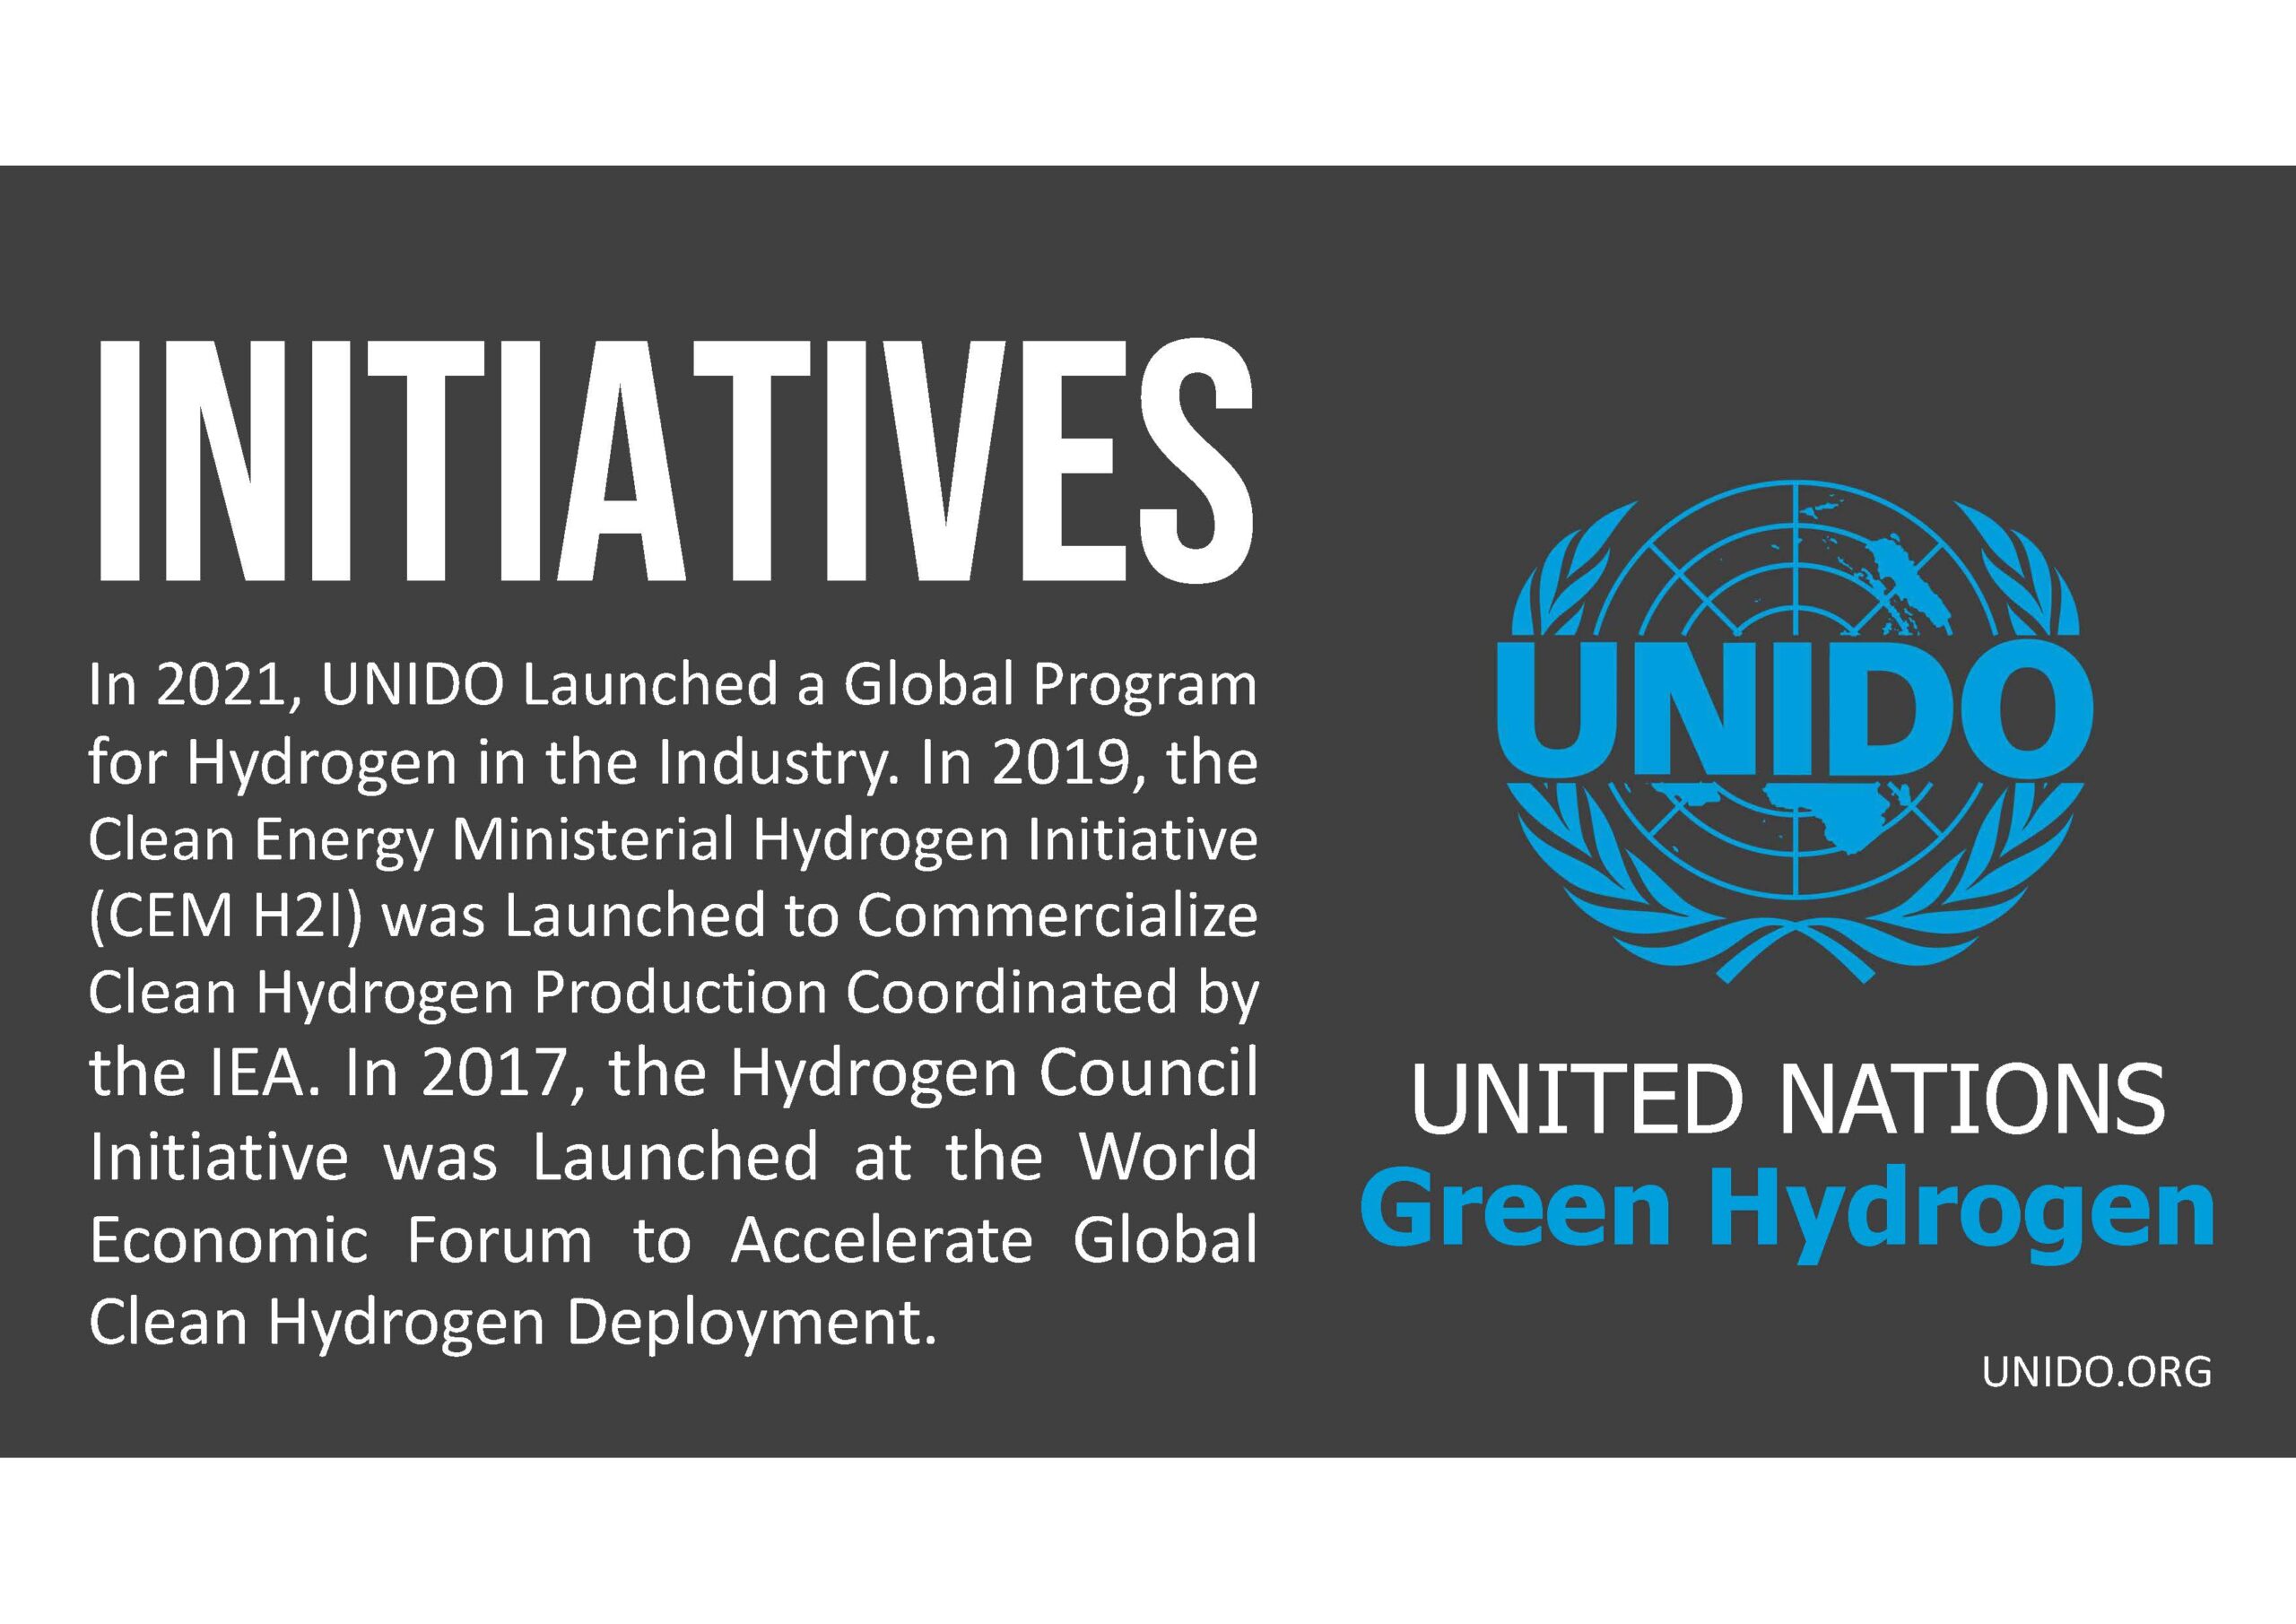
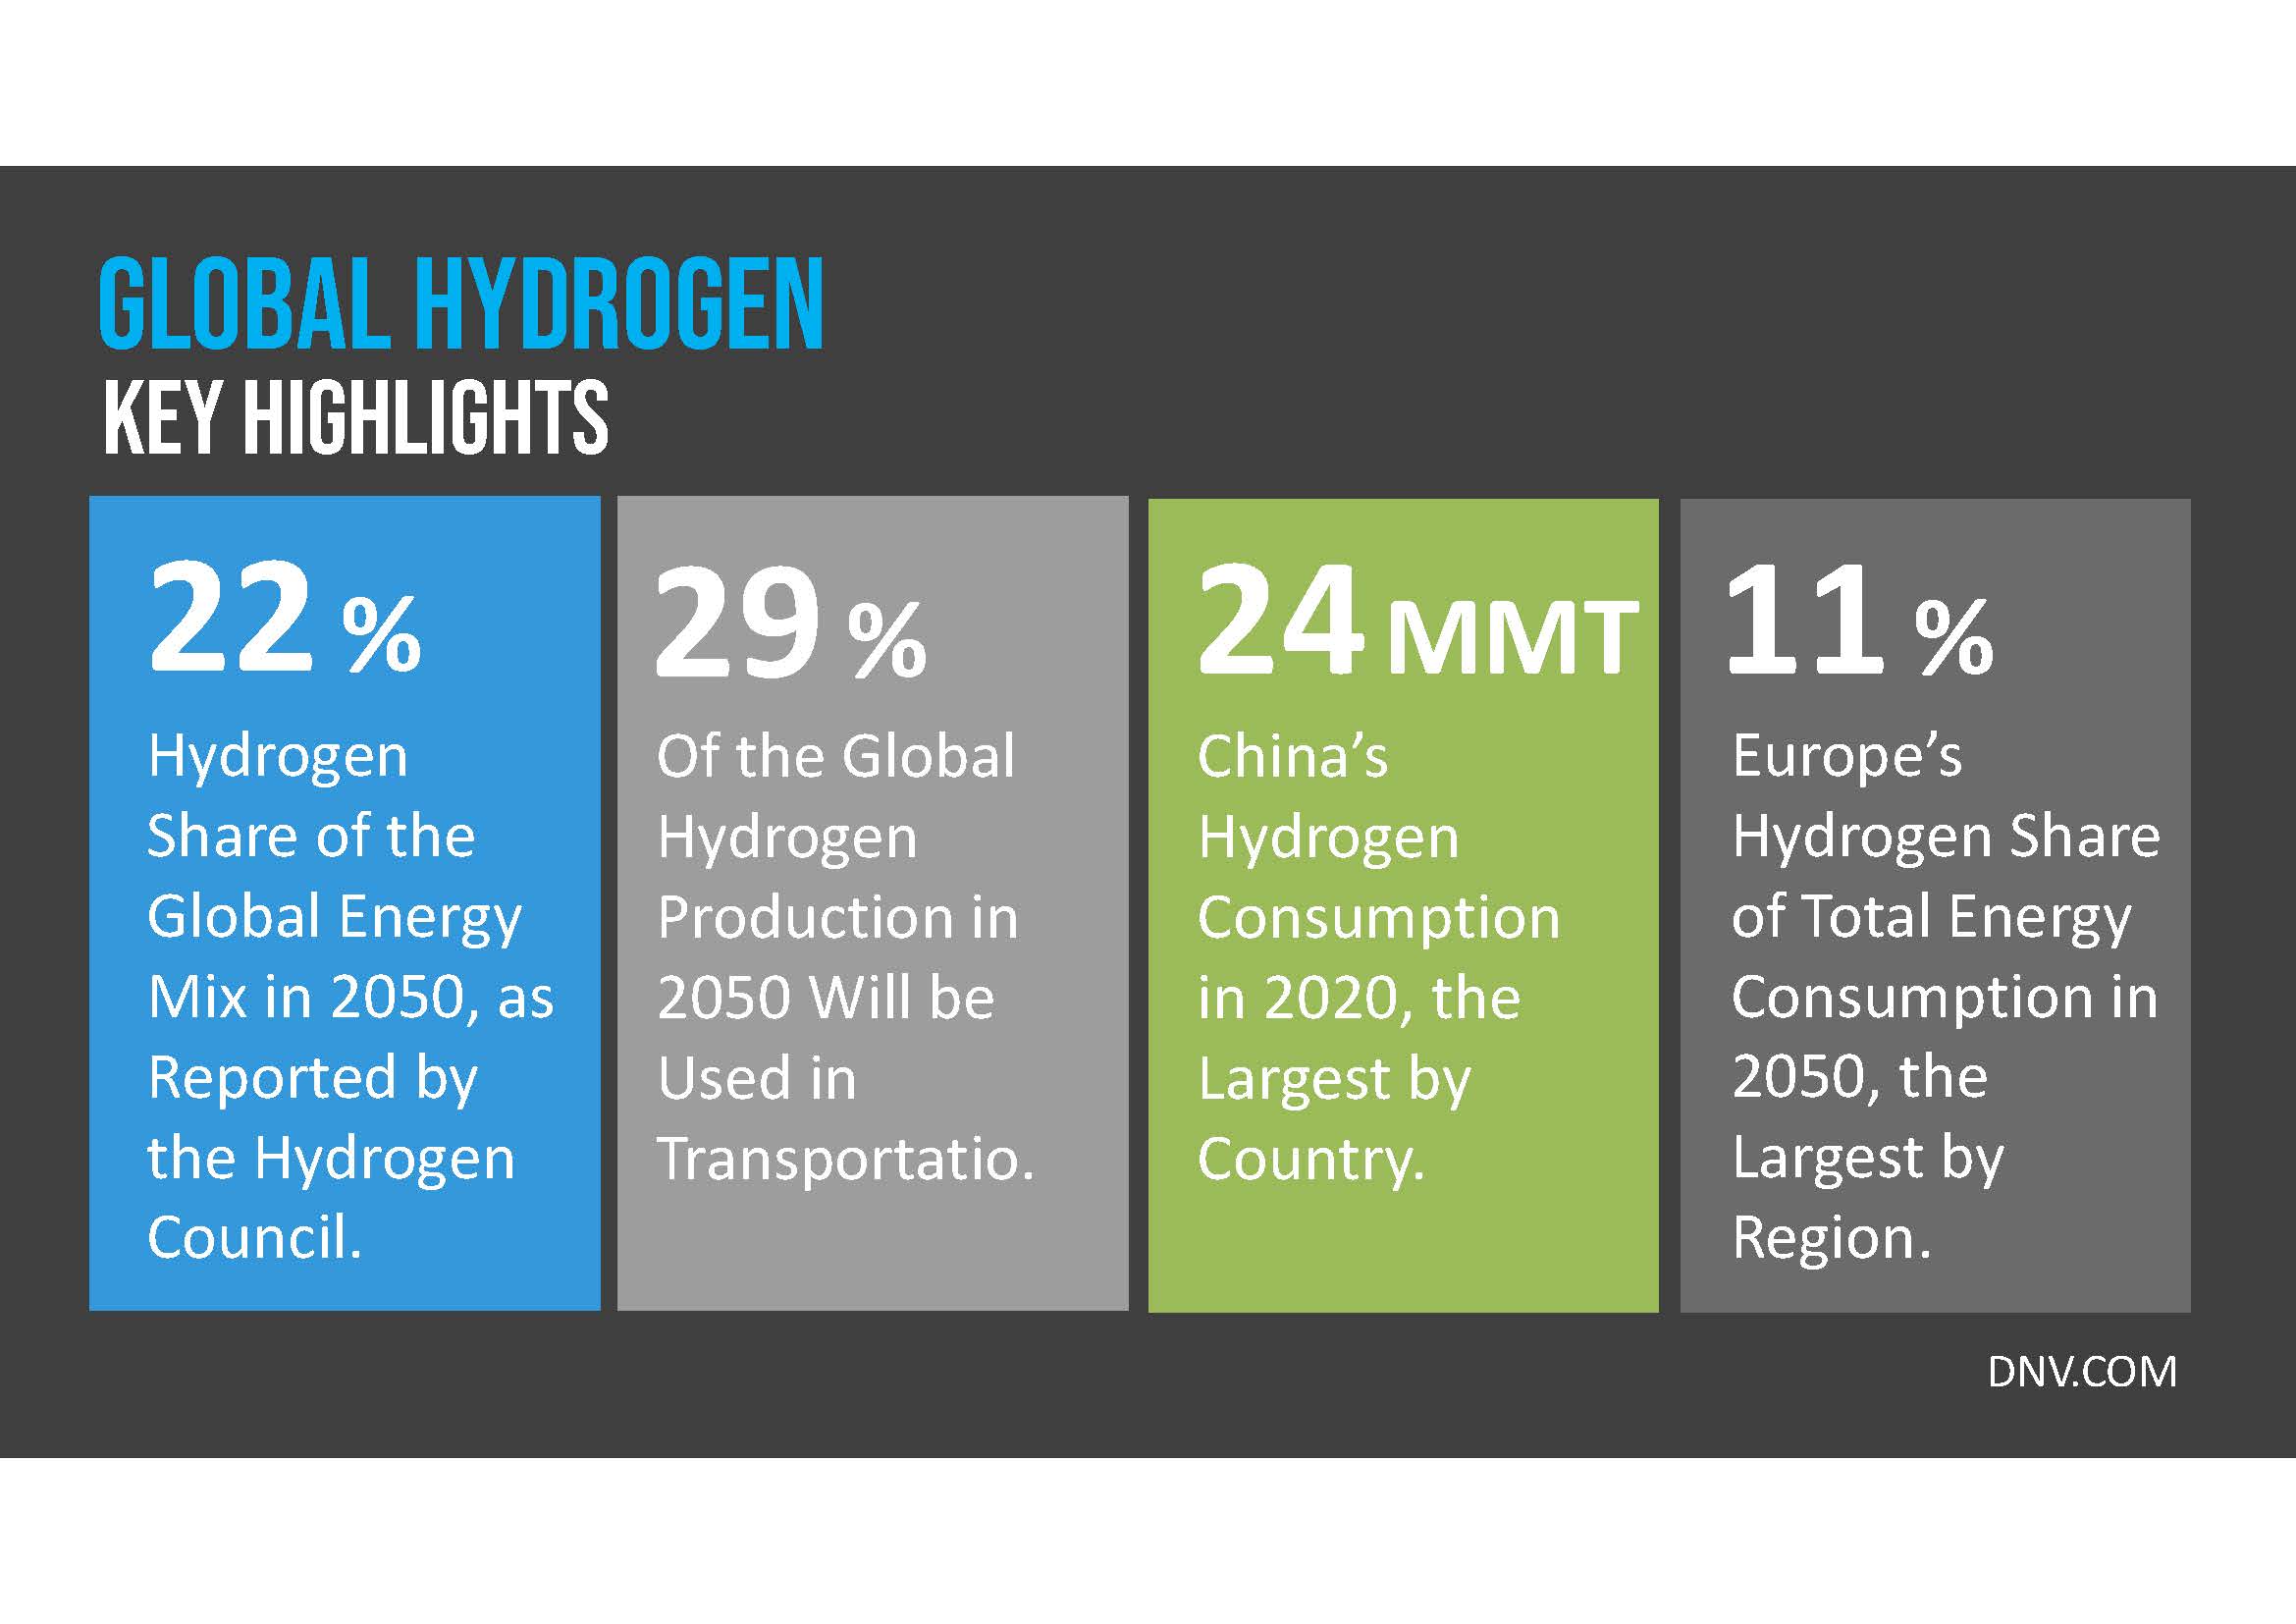
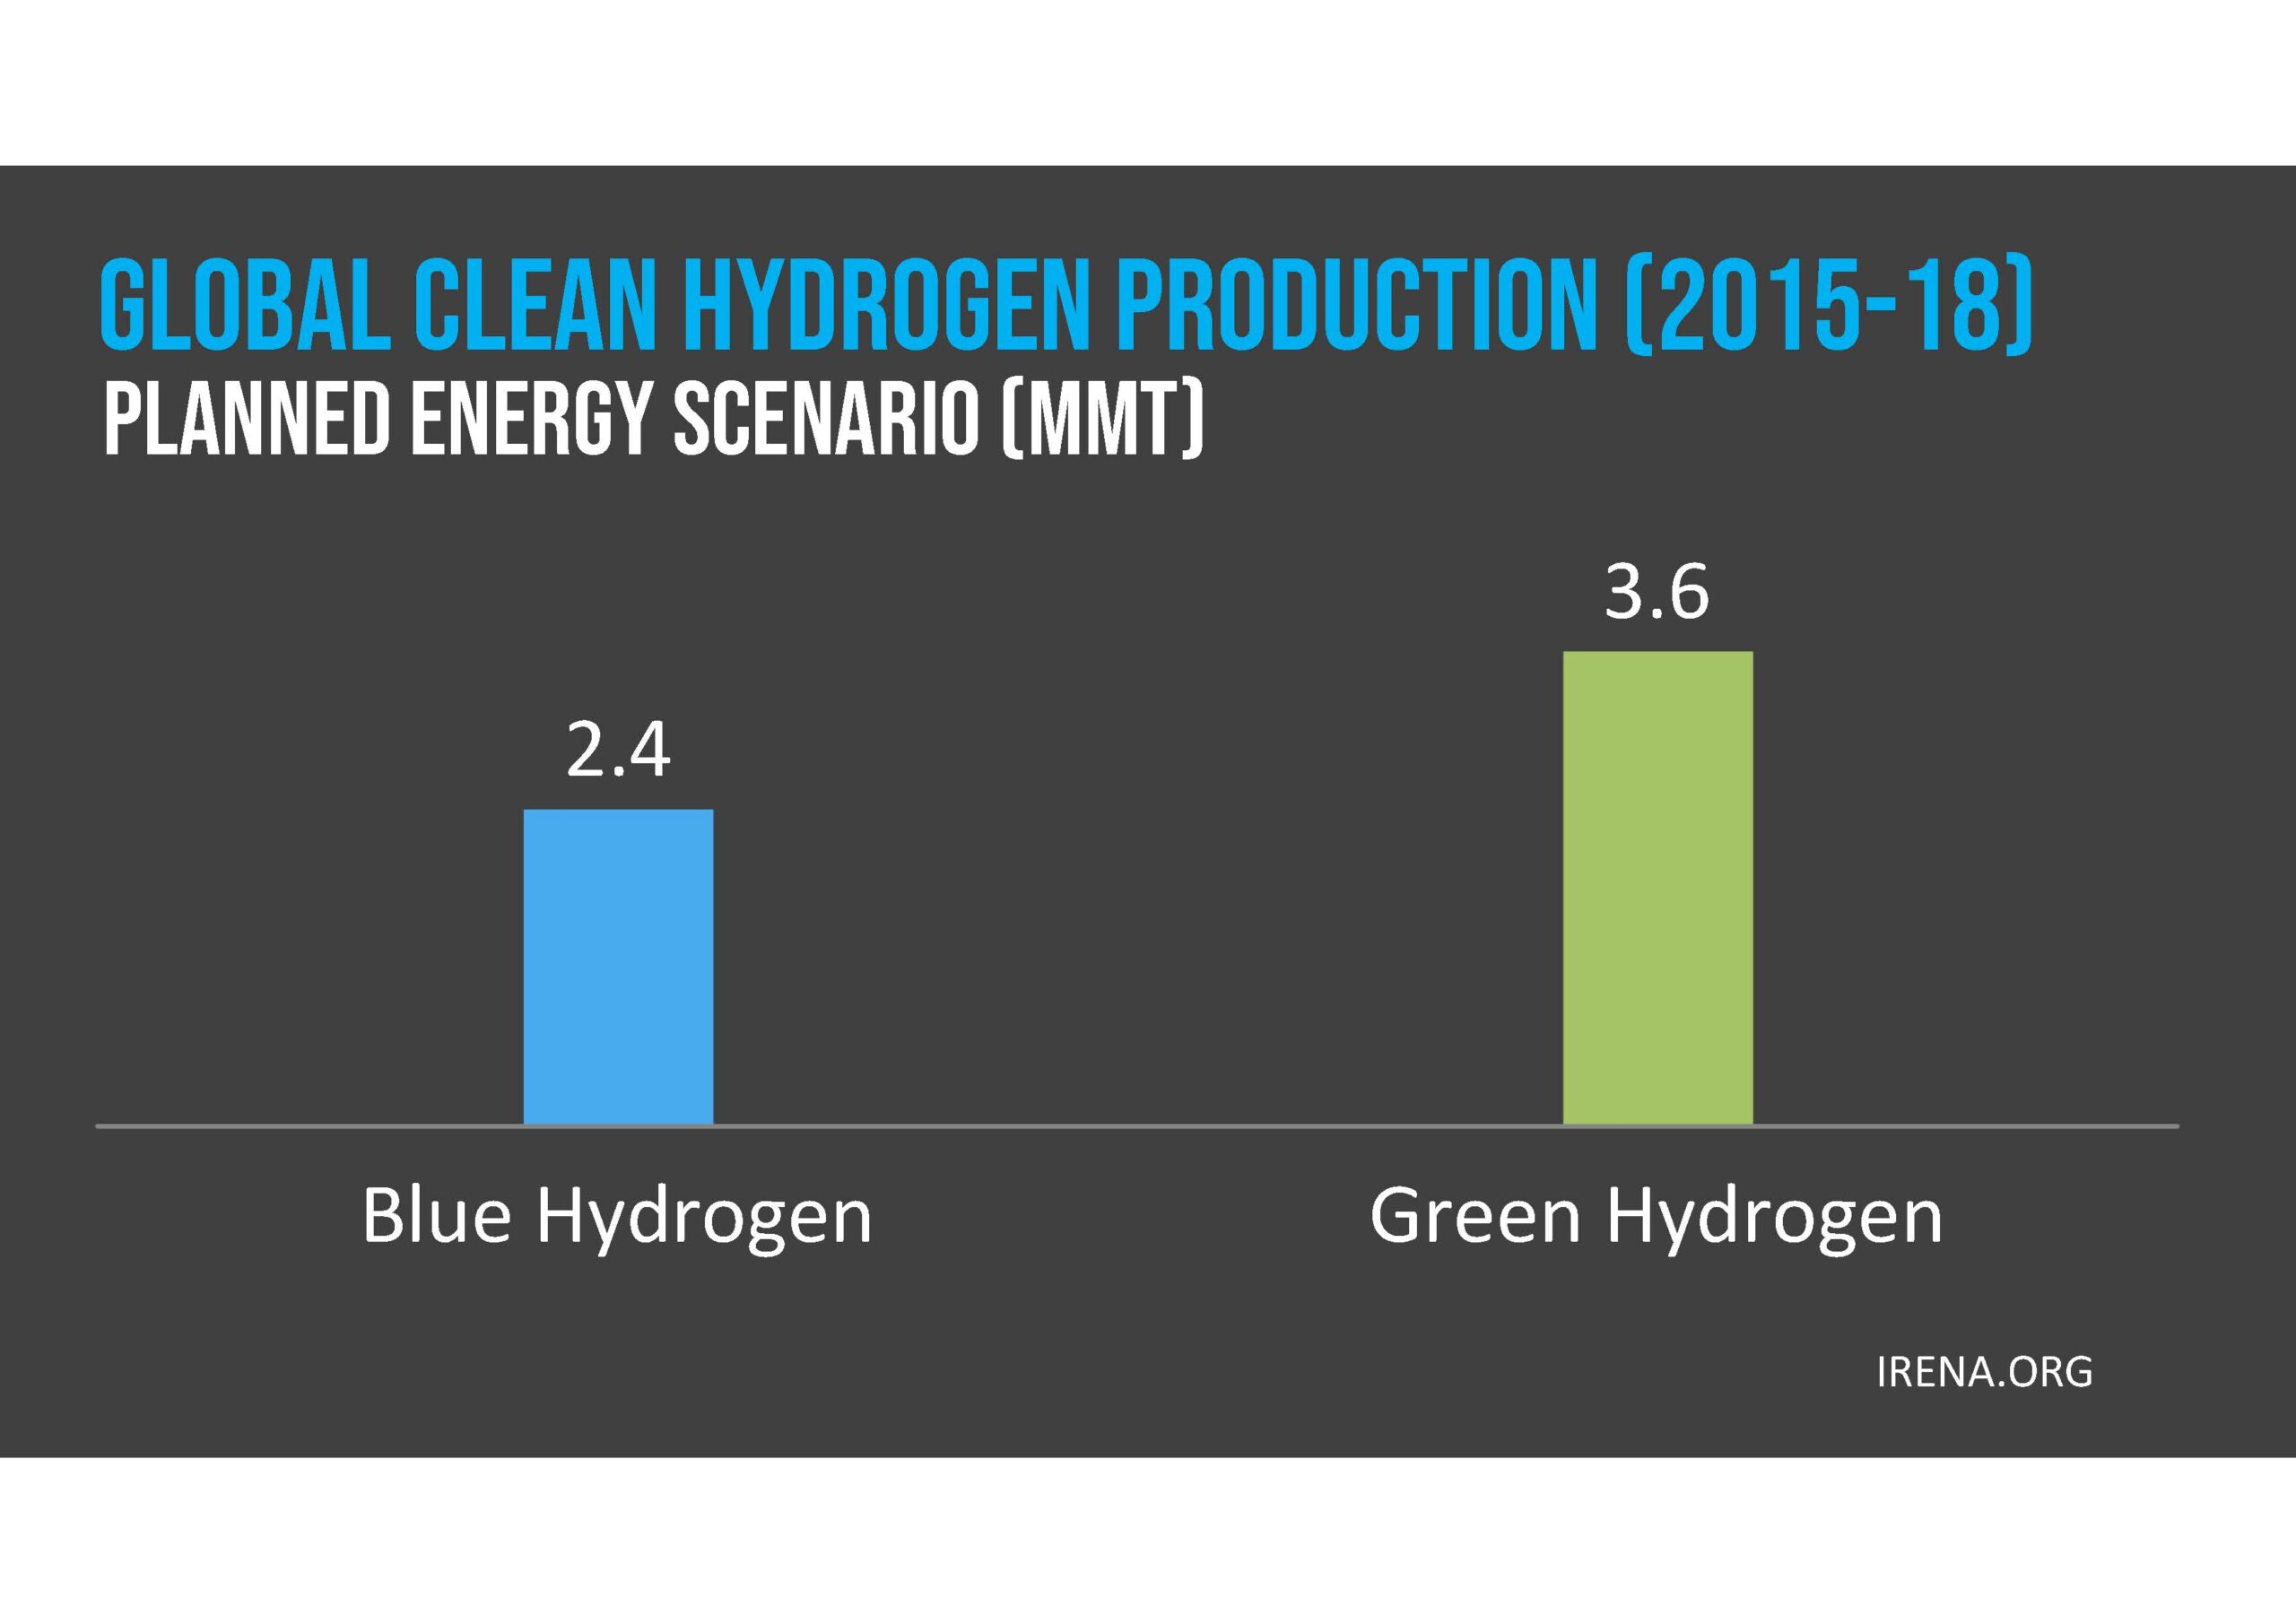
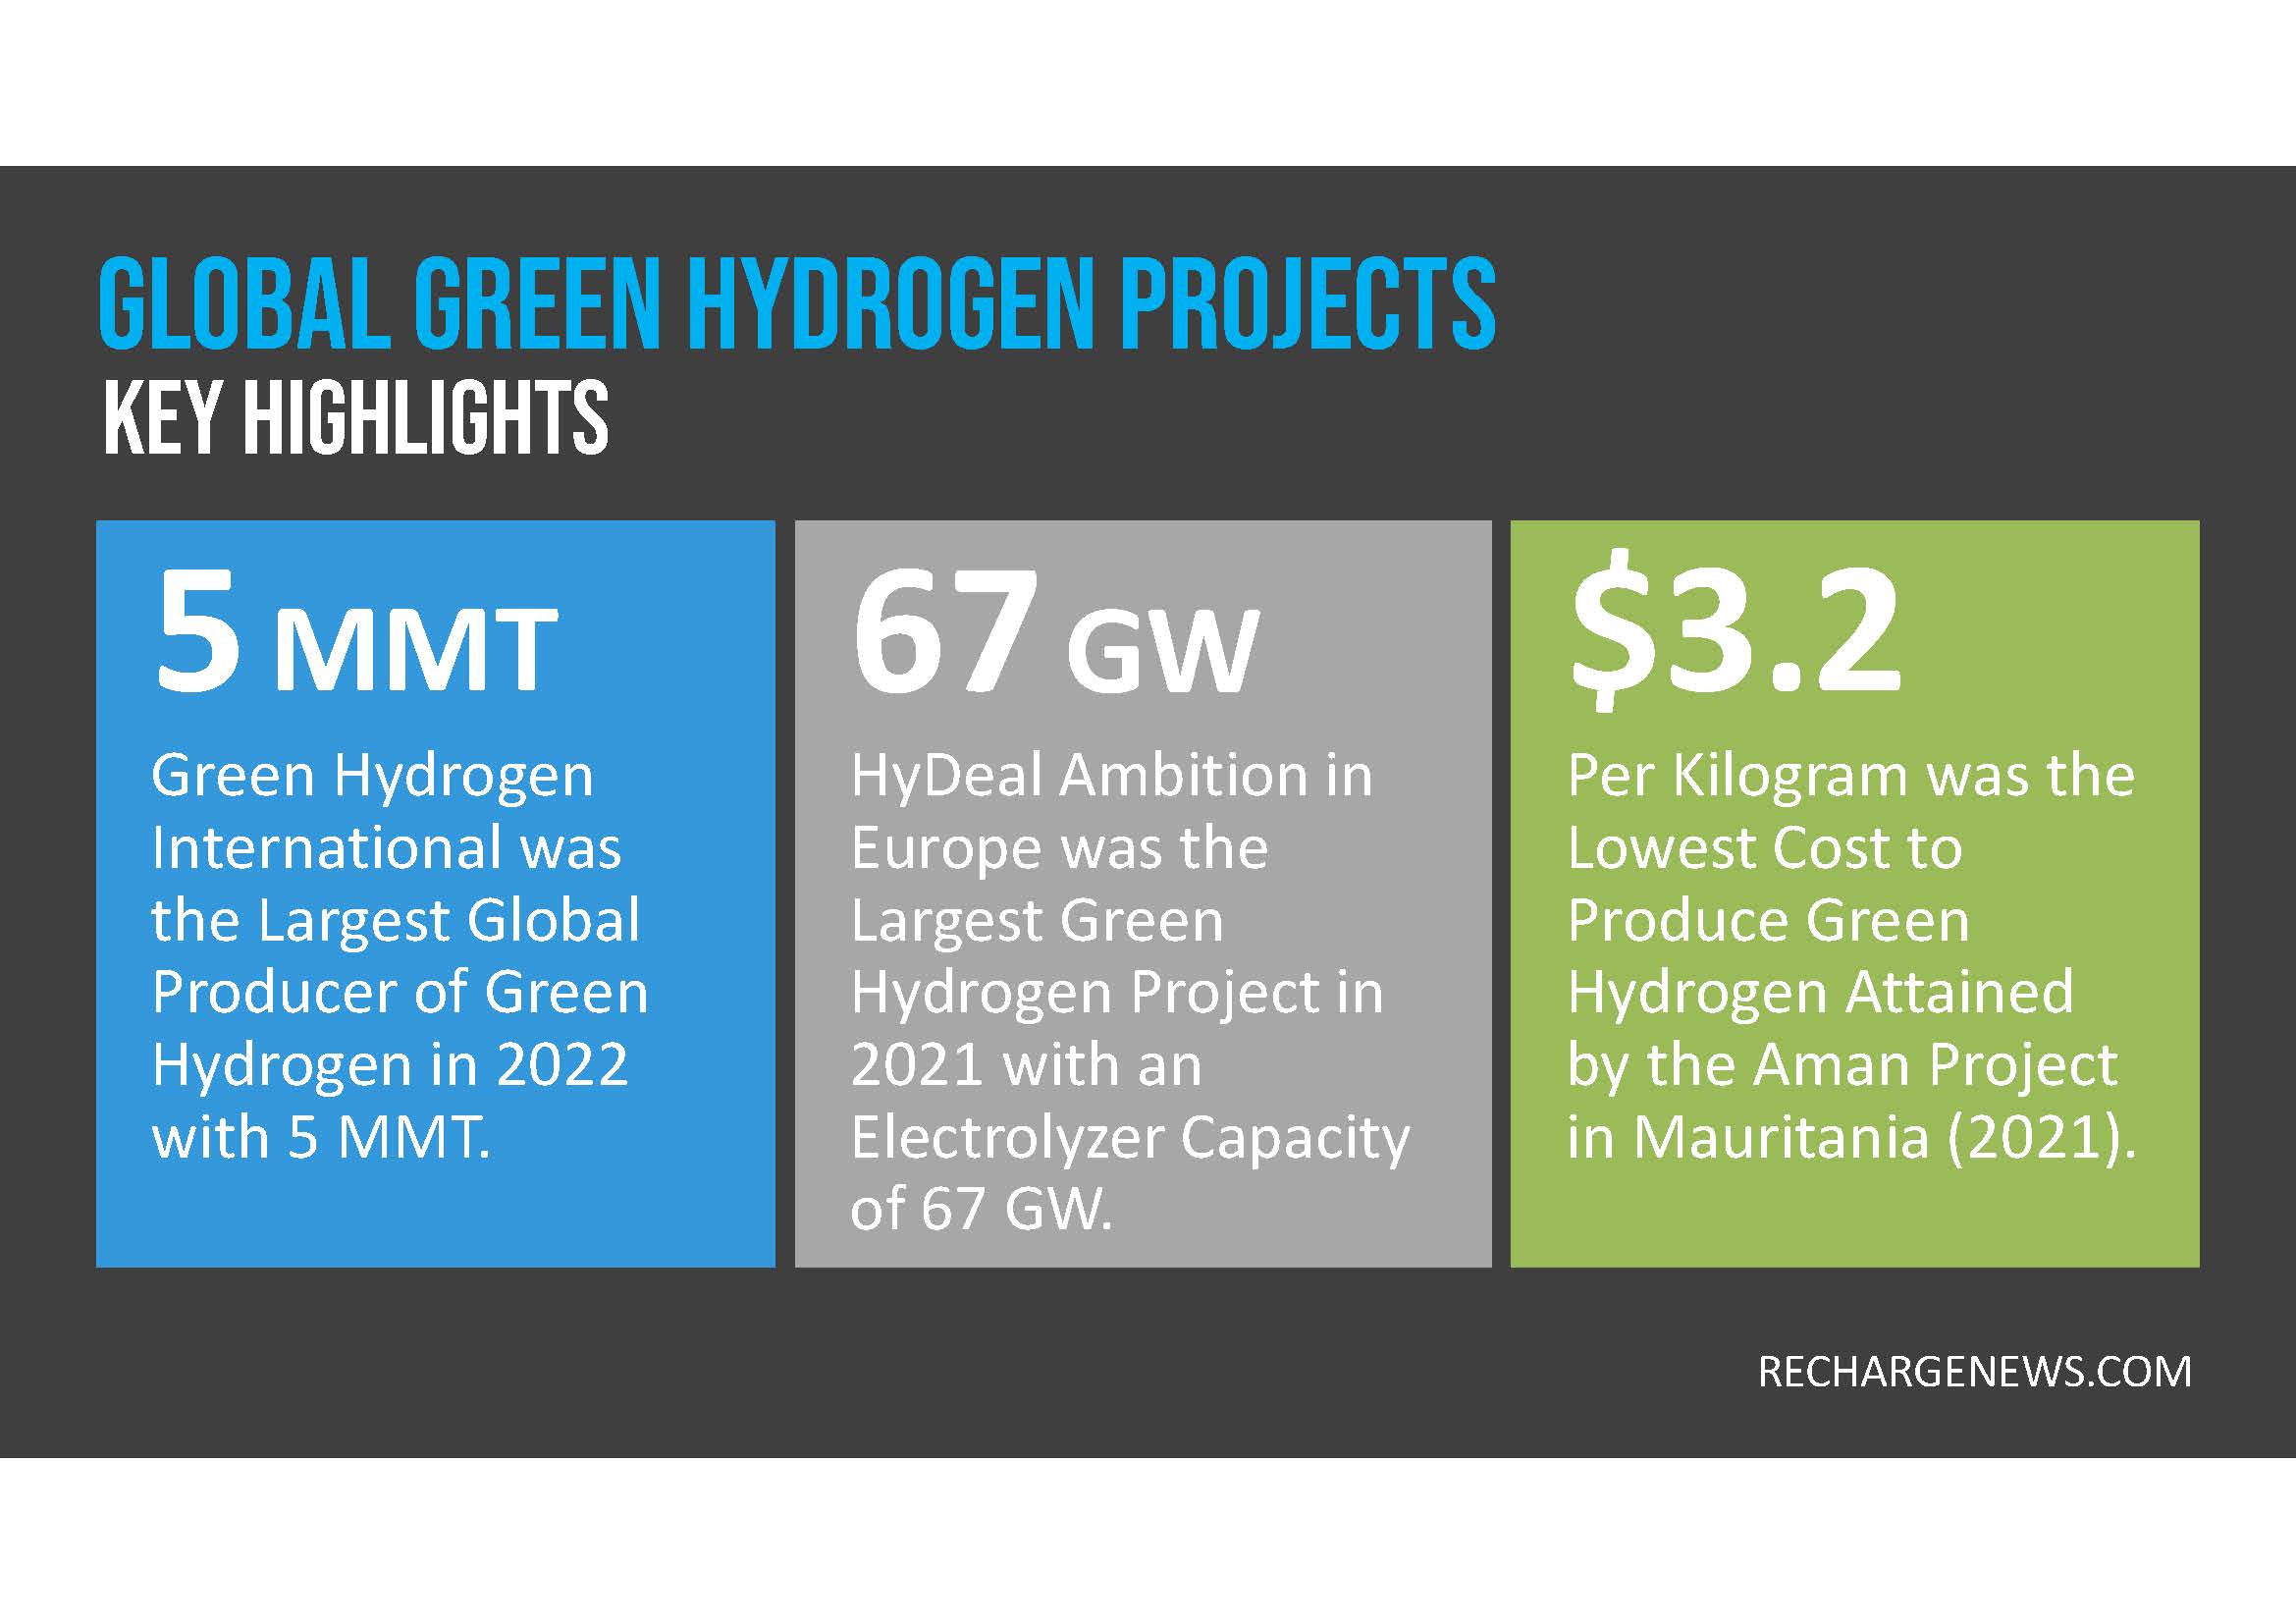
October 2025 – Hydrogen is a gas used in heavy industries like oil refining, fertilizers, and steel manufacturing. Green Hydrogen is produced using an electrolyzer which is a device that uses electricity to split water into hydrogen and oxygen. Electricity is supplied by renewable energy sources such as wind and solar with no carbon emissions, which can aid in the decarbonization efforts and combat climate change. In 2017, the hydrogen council initiative was launched at the World Economic Forum to accelerate global clean hydrogen deployment. In 2019, the Clean Energy Ministerial Hydrogen Initiative (CEM H2I) was launched to commercialize clean hydrogen production. In 2021, the United Nations Industrial Development Organization (UNIDO) launched a global program for hydrogen in the industry.

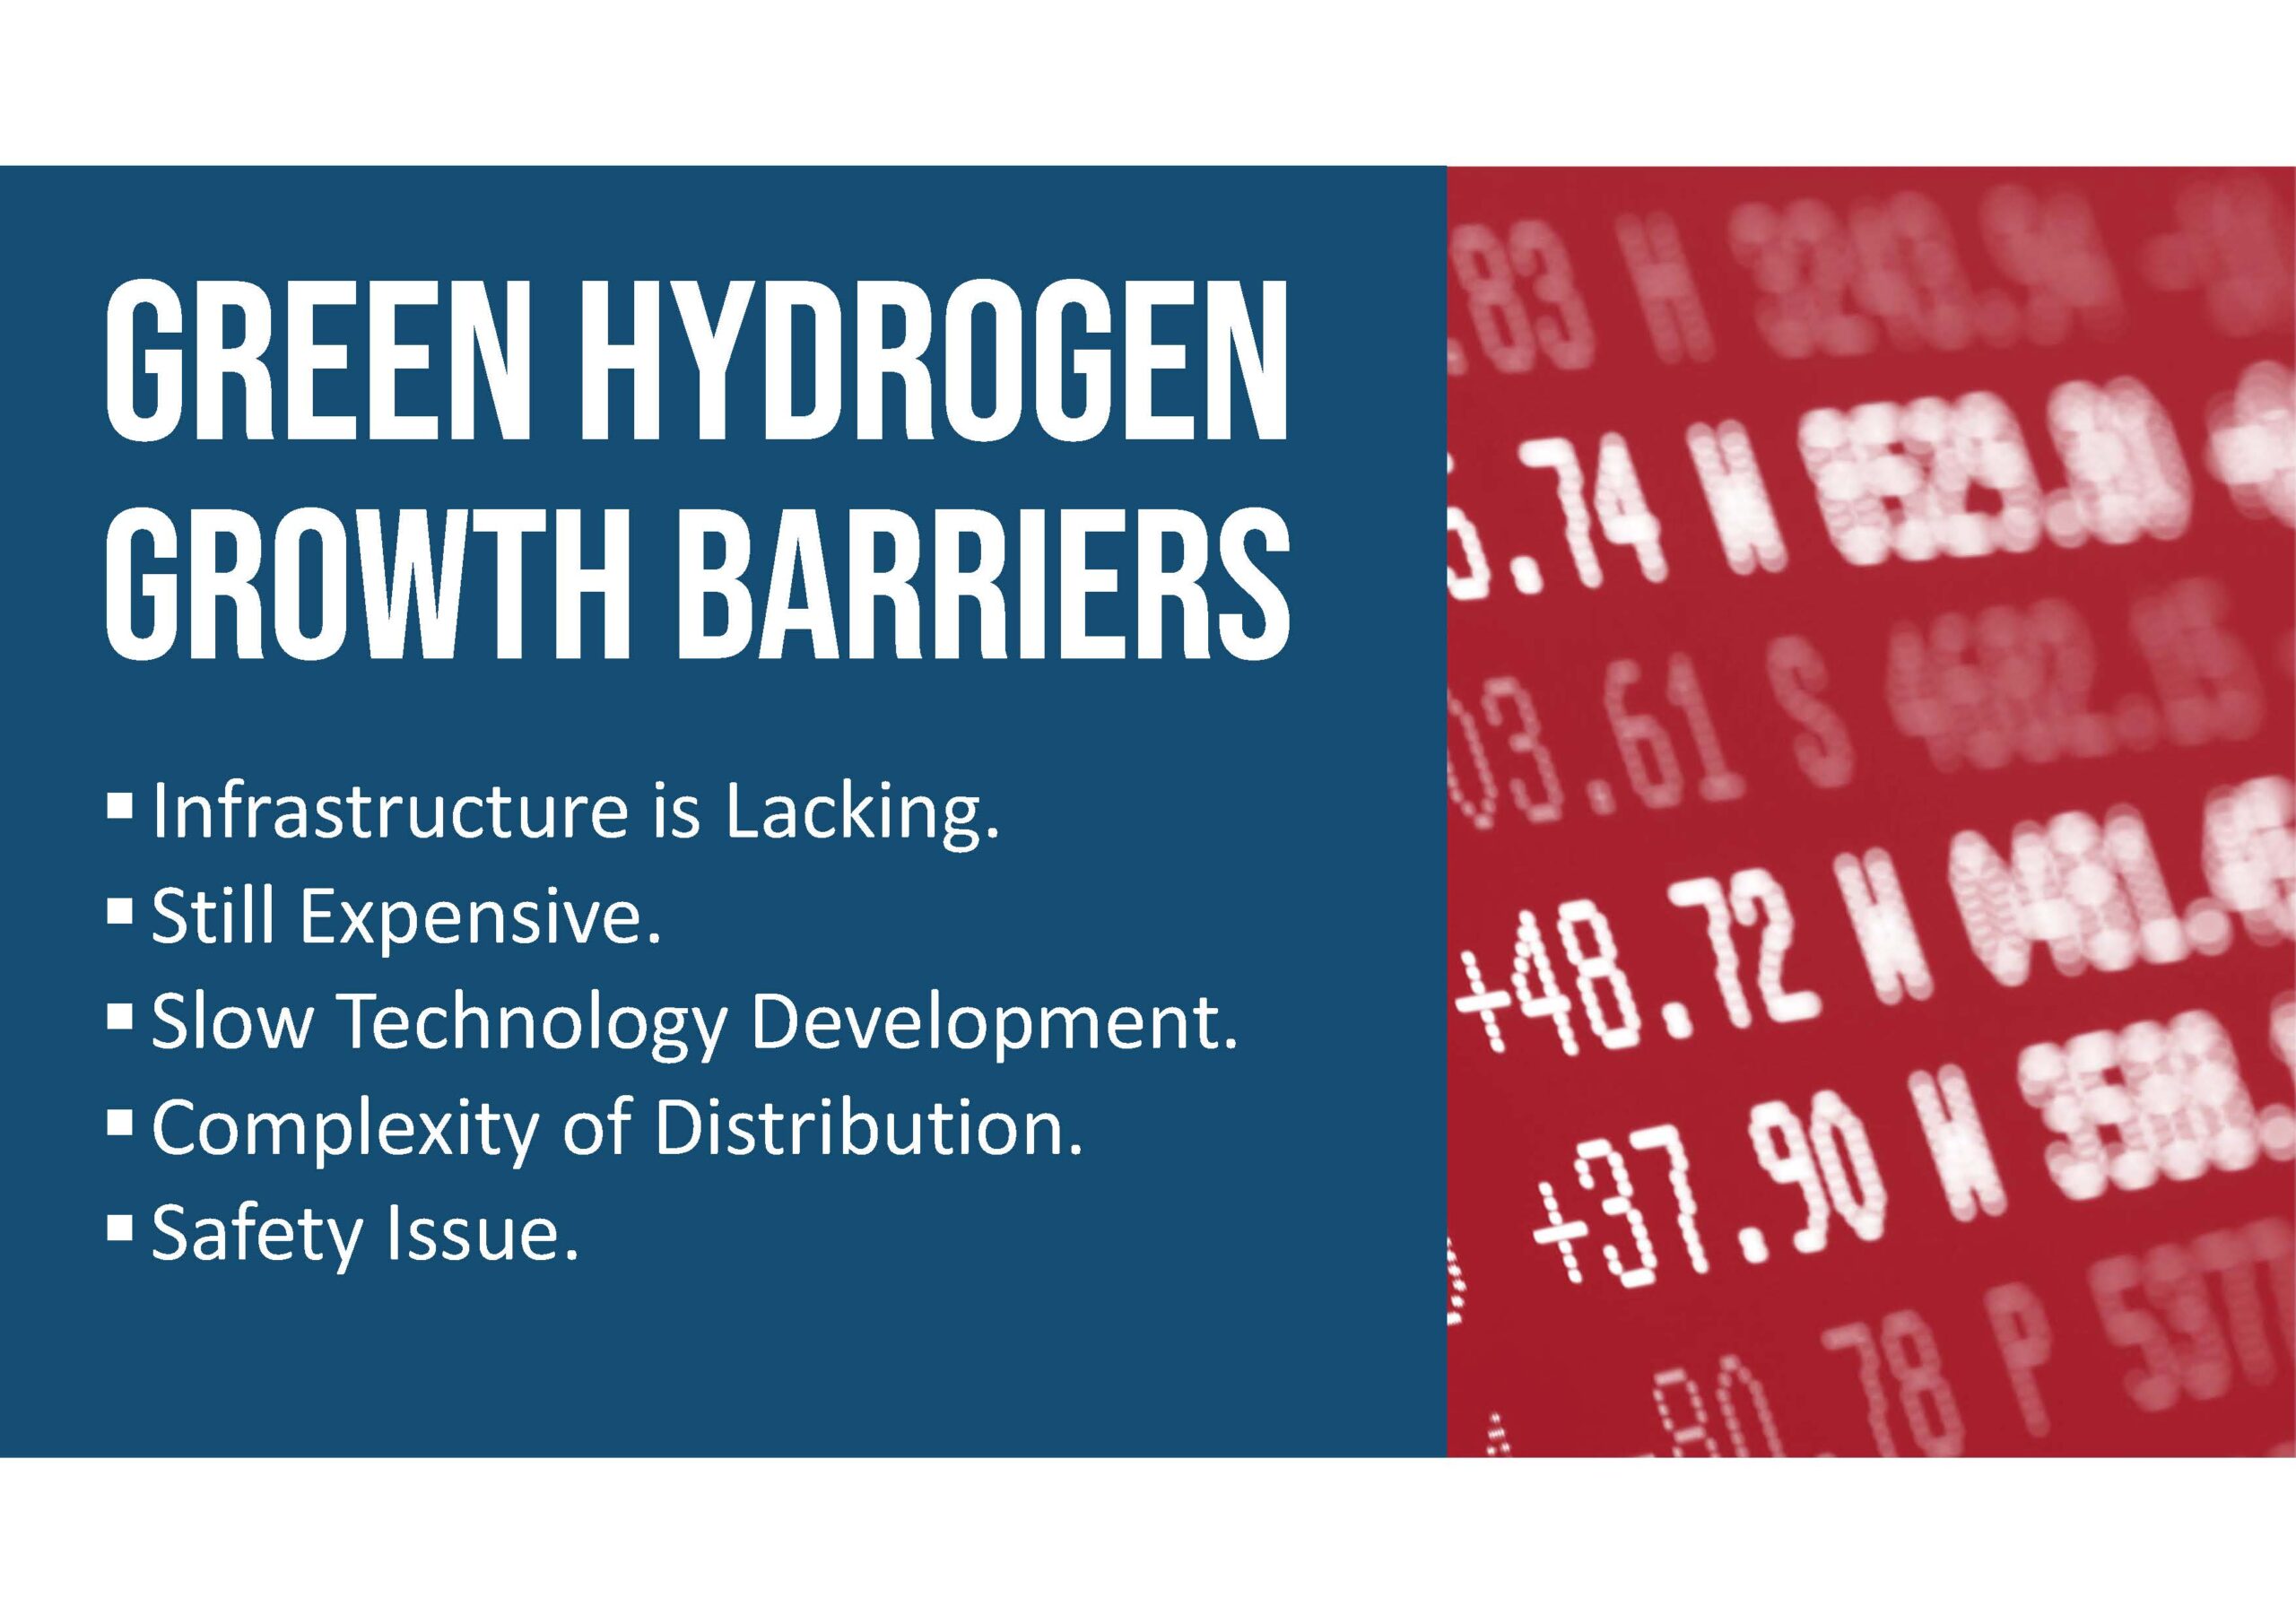
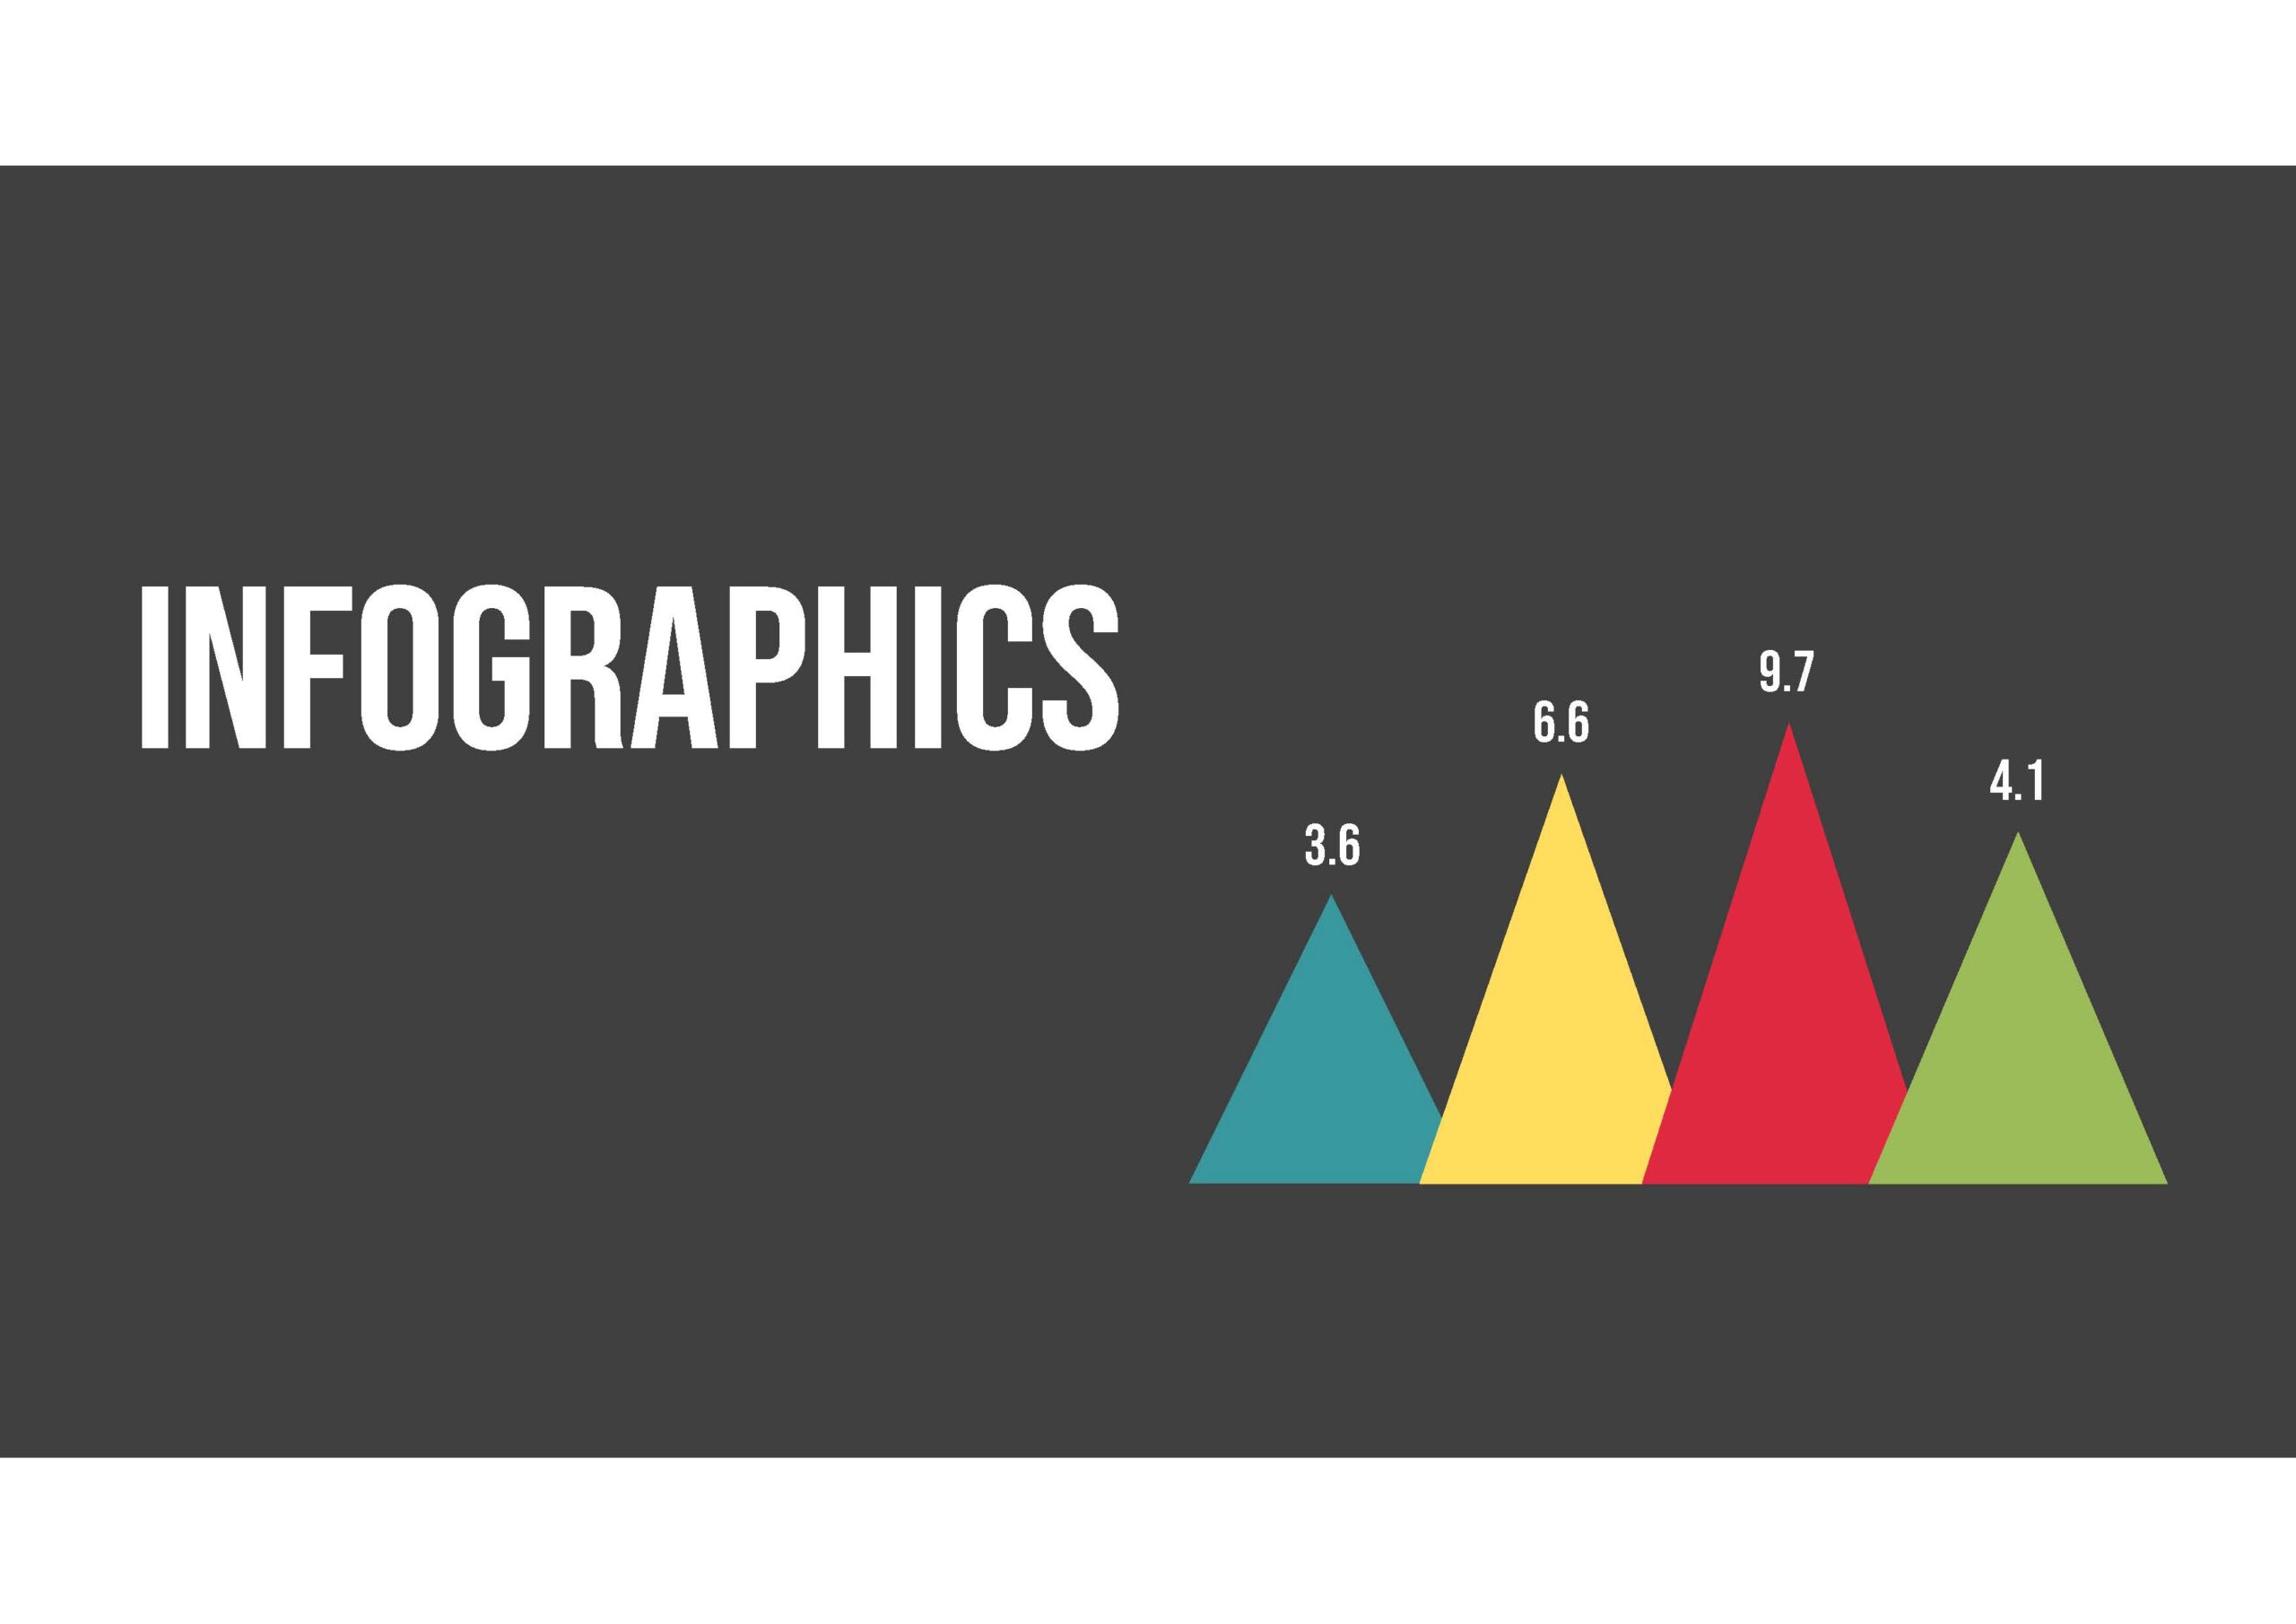
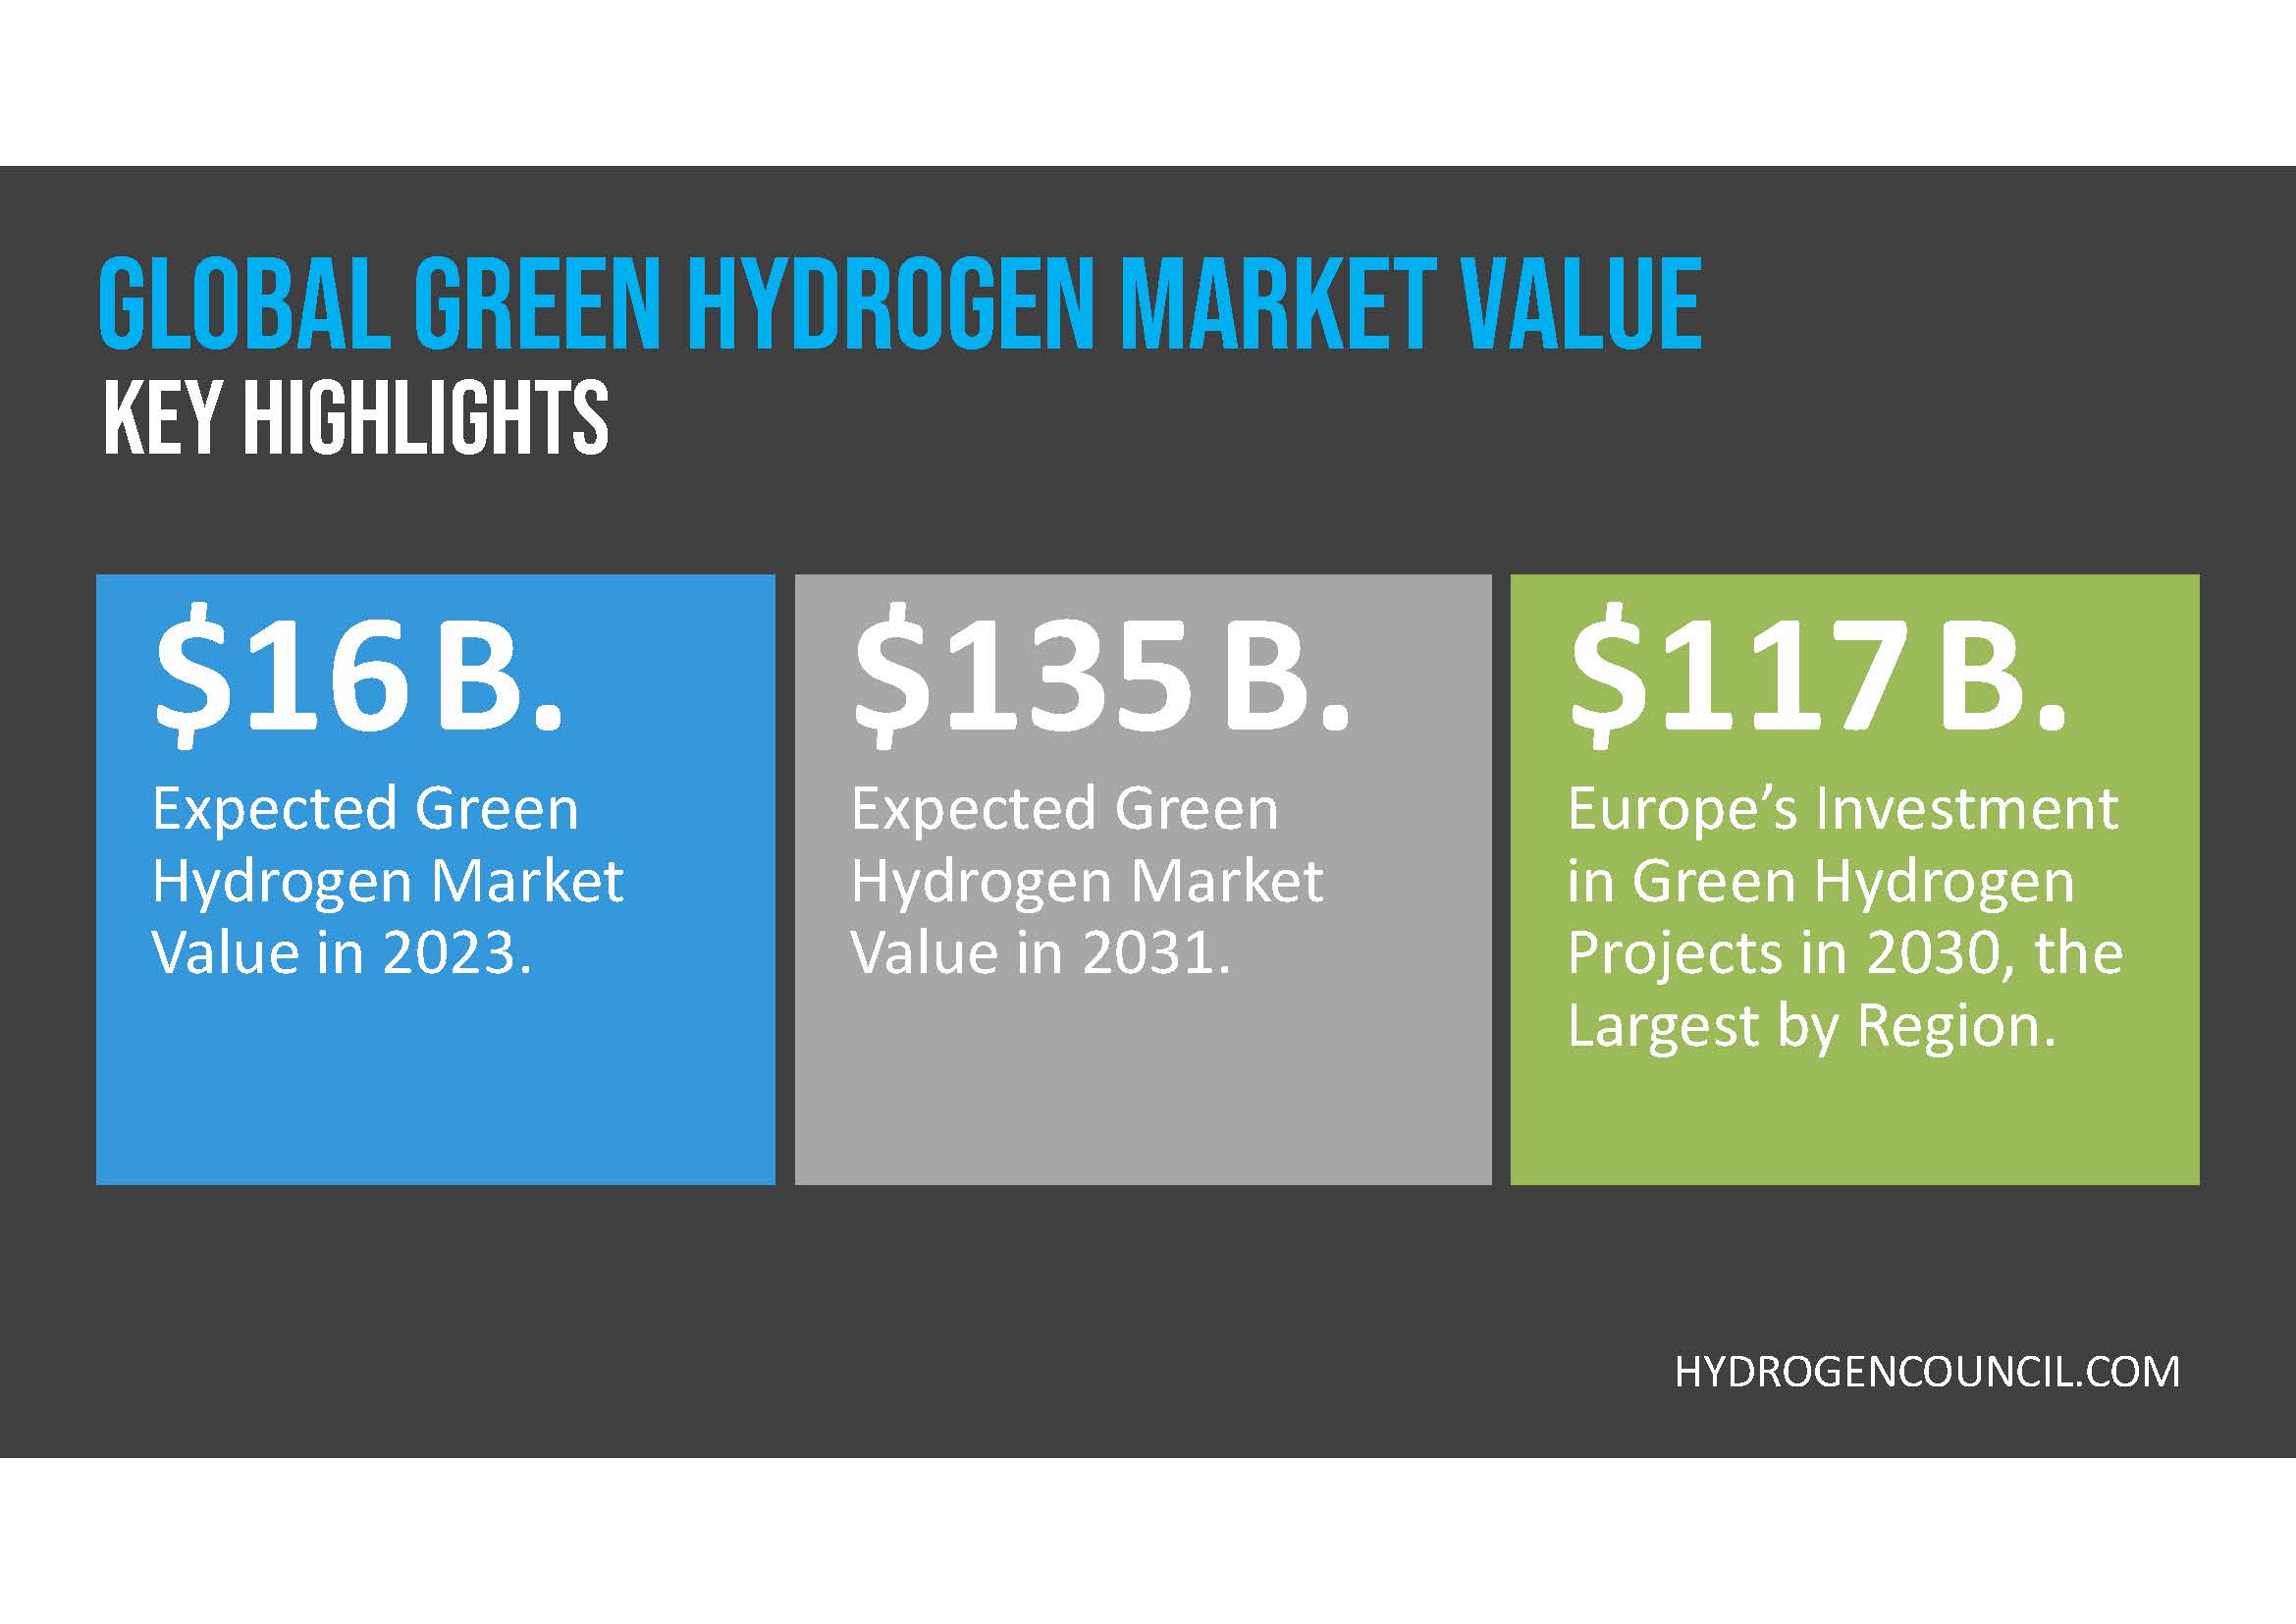
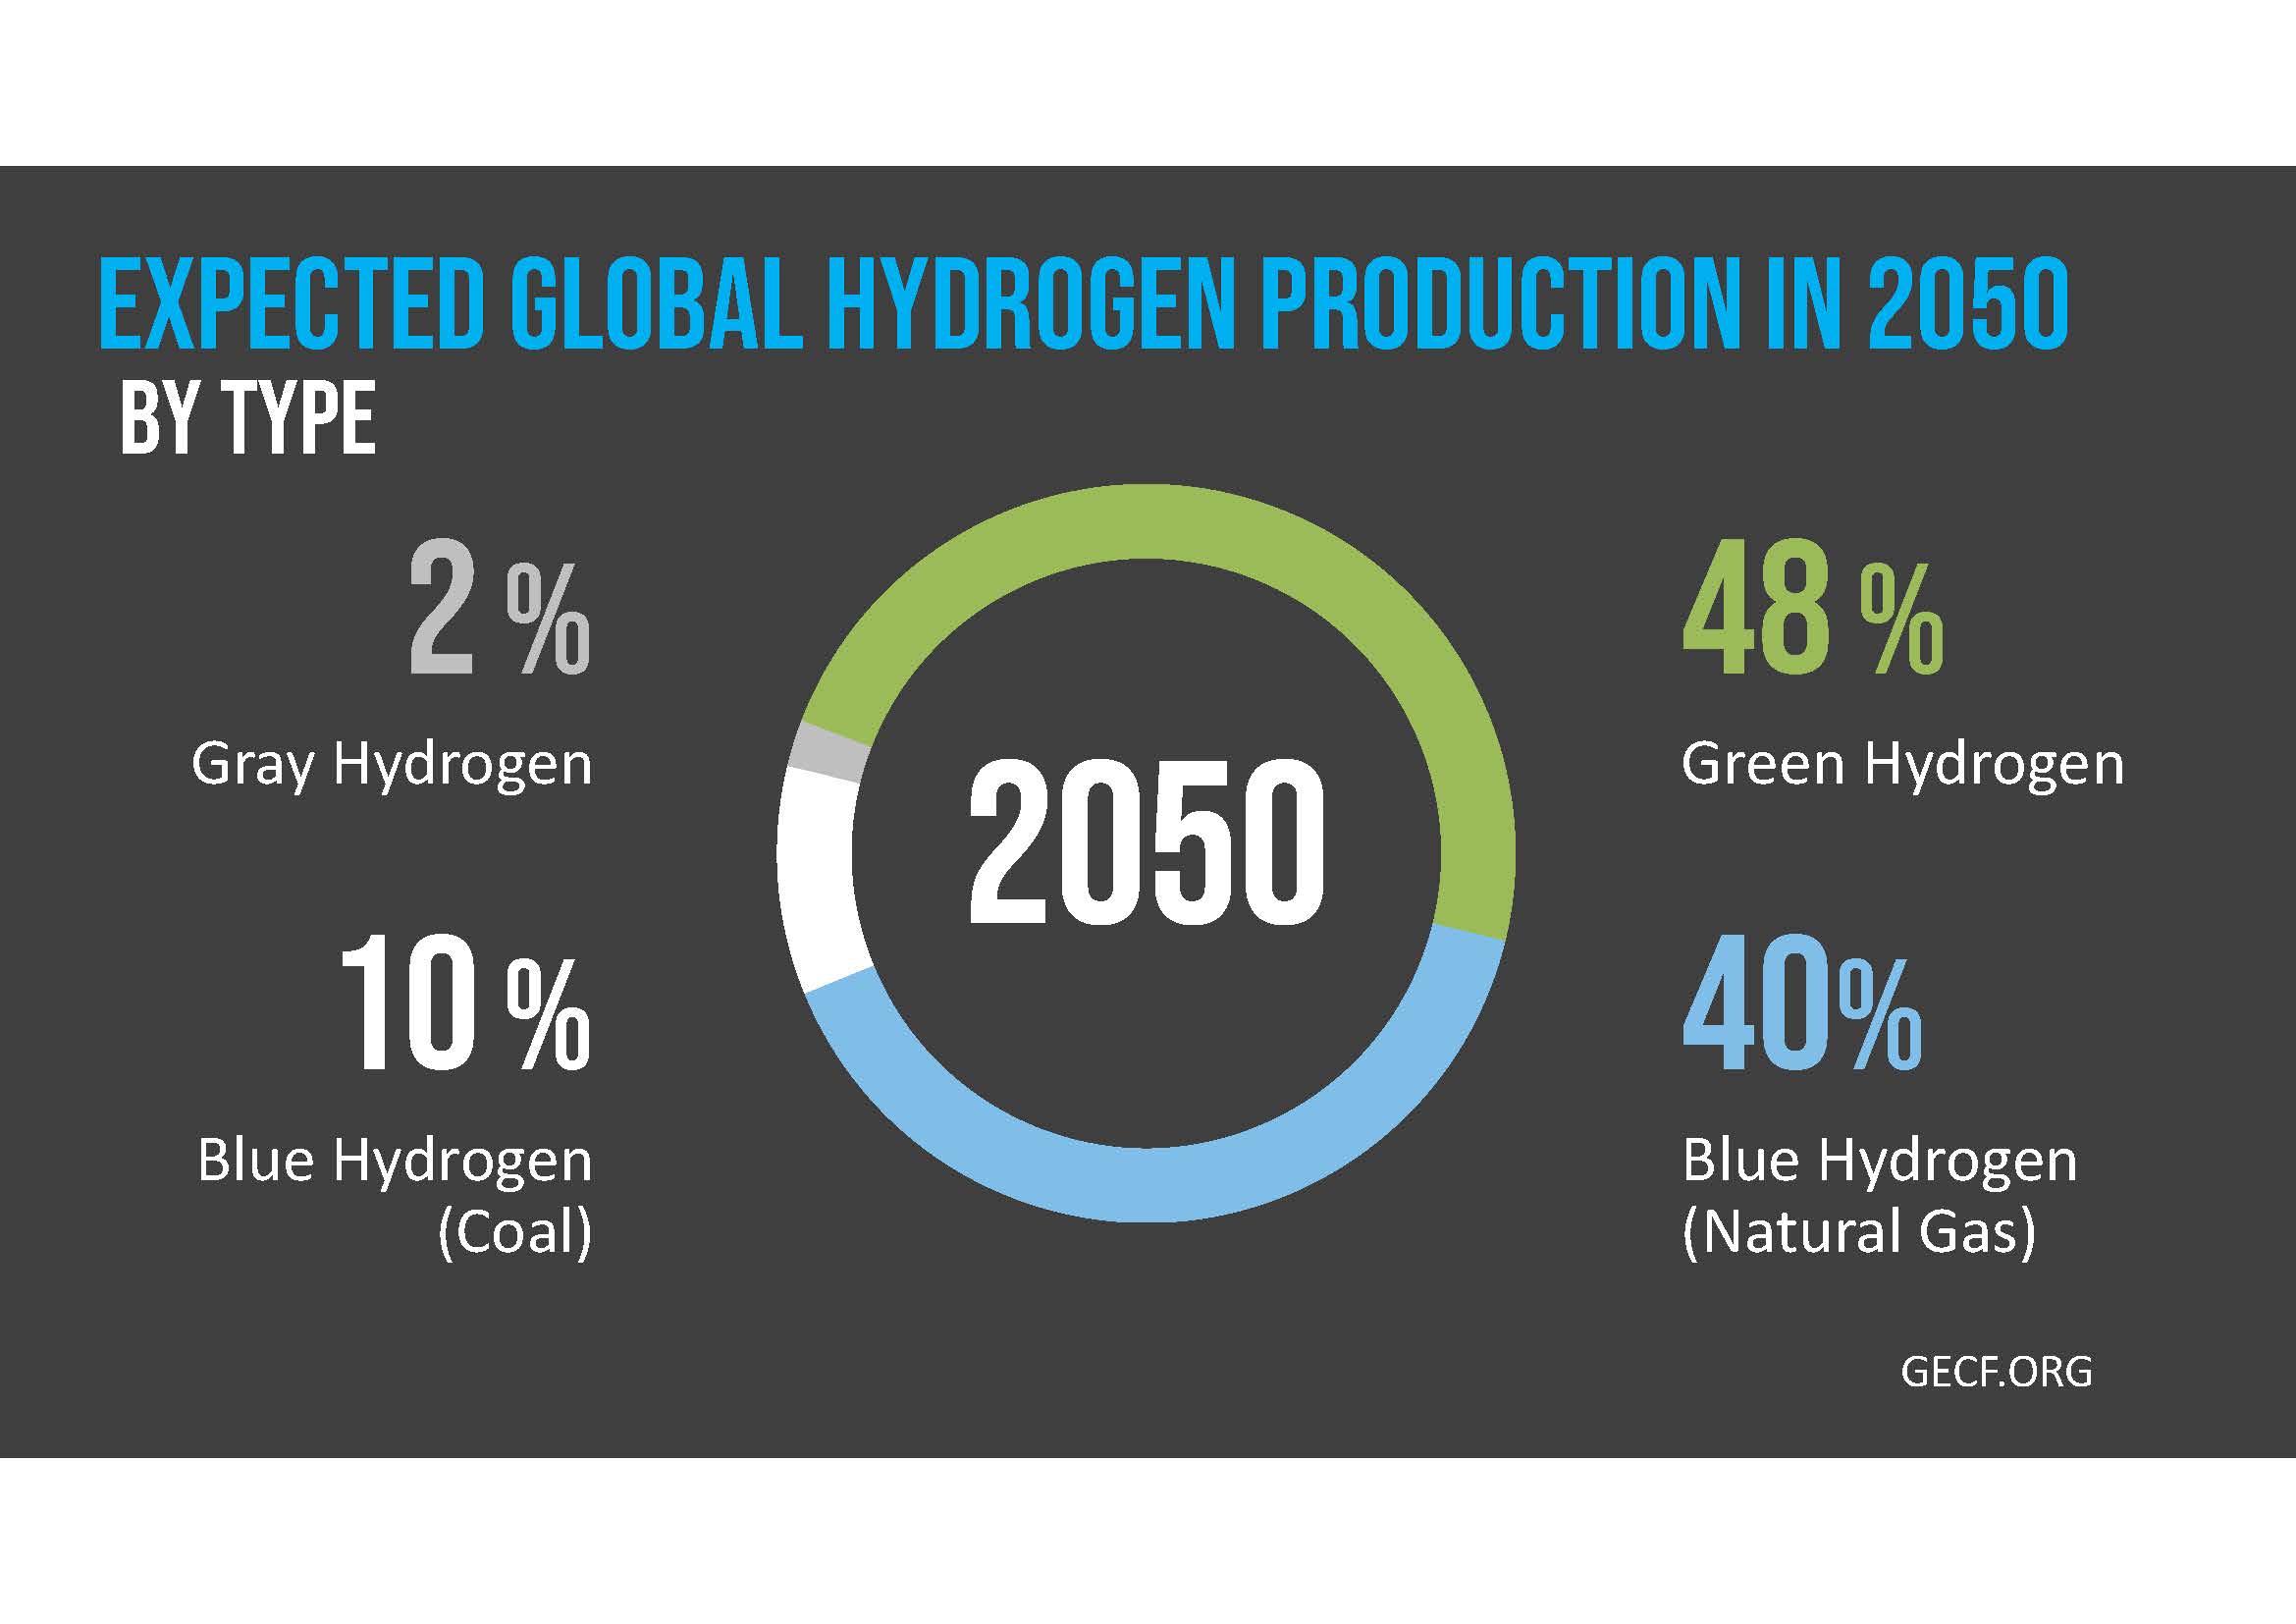
In this slideshow, you will learn about the definition, benefits, challenges, UN policy, and global statistics of green hydrogen production. Discover how green hydrogen technologies can reduce global carbon emissions, accelerate the clean energy transition, and meet net zero emission goals by the year 2050.

A notepad, pen, and laptop on a desk with a blue overlay listing agenda items: definition, benefits, UN policy, infographics, and market value numbered 1 to 5.
Close-up of an open dictionary page with the word “DEFINITION” highlighted in bold white text on a blue rectangle overlay.
Large storage tanks labeled "H2 Hydrogen" with text explaining hydrogen is used in oil refining, steel manufacturing, and fertilizer production.
Infographic explaining gray, blue, and green hydrogen: gray from fossil fuels with high emissions, blue from fossil fuels with carbon capture, green from renewable sources with no emissions.
Green and white storage tanks are situated beside several wind turbines at an industrial energy facility under a clear blue sky.
Image shows industrial electrolyzer machines with text explaining that an electrolyzer uses electricity to split water into hydrogen and oxygen, powered by clean energy sources like wind and solar.
Text listing green hydrogen growth drivers next to a blurred background of green and white financial numbers.
Green industrial pipes and equipment at a hydrogen production facility, with text explaining green hydrogen is made using renewable energy and produces no carbon emissions.
Illustration of wind turbines and solar panels generating electricity to produce green hydrogen (H2) through electrolysis.
A list of barriers to green hydrogen growth, including infrastructure, cost, technology, distribution, and safety, appears next to red stock market numbers.
A blue flag with the United Nations emblem is displayed next to a "Policy Support" text overlay, with blurred national flags in the background.
Text graphic titled "INITIATIVES" describing UNIDO's global programs and initiatives for hydrogen in industry, featuring the UNIDO logo and "United Nations Green Hydrogen" text.
A dark background with the word "INFOGRAPHICS" and four colored triangles labeled 3.6, 6.6, 9.7, and 4.1, representing data values.
Text on a dark background reads: "TOTAL HYDROGEN All types: Gray - Blue - Green" with "TOTAL HYDROGEN" in blue and the rest in white.
Bar chart showing expected hydrogen share of global energy mix in 2050: IRENA 12%, IEA 13%, Hydrogen Council 22%.
Bar chart showing expected global hydrogen production in 2050 by use: transportation 29%, feedstock 25%, energy 21%, buildings 14%, electricity generation 12%.
Bar chart showing global hydrogen consumption by country in 2020. China leads with 23.9 million metric tons, followed by the U.S. with 11.3, and India with 7.2.
Infographic showing key highlights on global hydrogen: 22% energy share by 2050, 29% for transport, 24 MMT in China (2020), and 11% energy share in Europe by 2050.
Bar chart comparing global clean hydrogen production (2015–2018): Blue Hydrogen at 2.4 MMT and Green Hydrogen at 3.6 MMT, according to a planned energy scenario.
Text reads: "Gray vs. Green vs. Blue Hydrogens" on a dark gray background, with "GRAY," "GREEN," and "BLUE" in blue font and "HYDROGENS" in white.
Infographic showing global green hydrogen market: $16B in 2023, $135B expected in 2031, and Europe investing $117B in 2030, the largest by region.
Bar chart showing global green hydrogen market value rising from $2.1 billion in 2021 to $135.4 billion in 2031, with a red circle highlighting 60X growth.
Bar graph showing global green hydrogen market value from 2023 to 2027, increasing from $15.9B in 2023 to $20.5B in 2027, with a 30% growth indicator.
A hand holding soil with a plant growing, topped with a coin. The text "MARKET VALUE" appears on a dark background.
Infographic showing global green hydrogen production highlights: 96 plants in Australia (2022), 13 MMT in Europe (2030), and 1.3 ZJ in Sub-Saharan Africa (2050).
Bar graph showing the number of large green hydrogen plants in 2022 by country; Australia leads with 96, followed by Germany and Spain with 50 each, and others with fewer plants.
Infographic with key highlights on global green hydrogen projects: top producer, largest project capacity in Europe, and lowest production cost in Mauritania.
Bar chart showing the largest global green hydrogen projects in 2021 by electrolyzer capacity (GW), with HyDeal Ambition in Europe leading at 67 GW.
Bar chart showing leading global green hydrogen producers in 2022, with Green Hydrogen Int'l at 5,000 KMT/year, followed by Fortescue Future Ind. at 2,971 KMT/year.
Text graphic with the words "GREEN HYDROGEN PRODUCTION" in blue and "WORLDWIDE" in white on a dark gray background.
A pie chart shows expected global hydrogen production in 2050: 48% green, 40% blue (natural gas), 10% blue (coal), and 2% gray hydrogen.
S2ADesign.com logo with a blue lightning bolt icon on a dark gray background.
error: Content is protected !!