Artificial Intelligence (AI) Global Data

May 2024 – Artificial Intelligence (AI) is a field of computer science that focuses on creating intelligent machines capable of performing tasks requiring human intelligence. Machine Learning (ML) is a subset of AI that uses global data and algorithms to mimic human learning, enhancing its accuracy over time. AI Computer Vision utilizes ML and neural networks to interpret digital images and videos, making recommendations and taking actions when necessary. Natural Language Processing (NLP) combines computational linguistics with statistical and ML models to understand and generate text and speech. Autonomous AI are advanced systems that operate with minimal or no human intervention and can perform various tasks and analyze large data sets. Generative AI is based on deep-learning models that can generate high-quality text, images and other content based on simulations and training data.

In this slideshow, you will learn about the global statistics of AI. Global data AI including market value, corporate investment and spending, leading countries in AI, machine learning, AI Computer Vision, AI Robots, AI NLP, Autonomous AI, and Generative AI. 

artificial intelligence ppt.
artificial intelligence ai ppt.
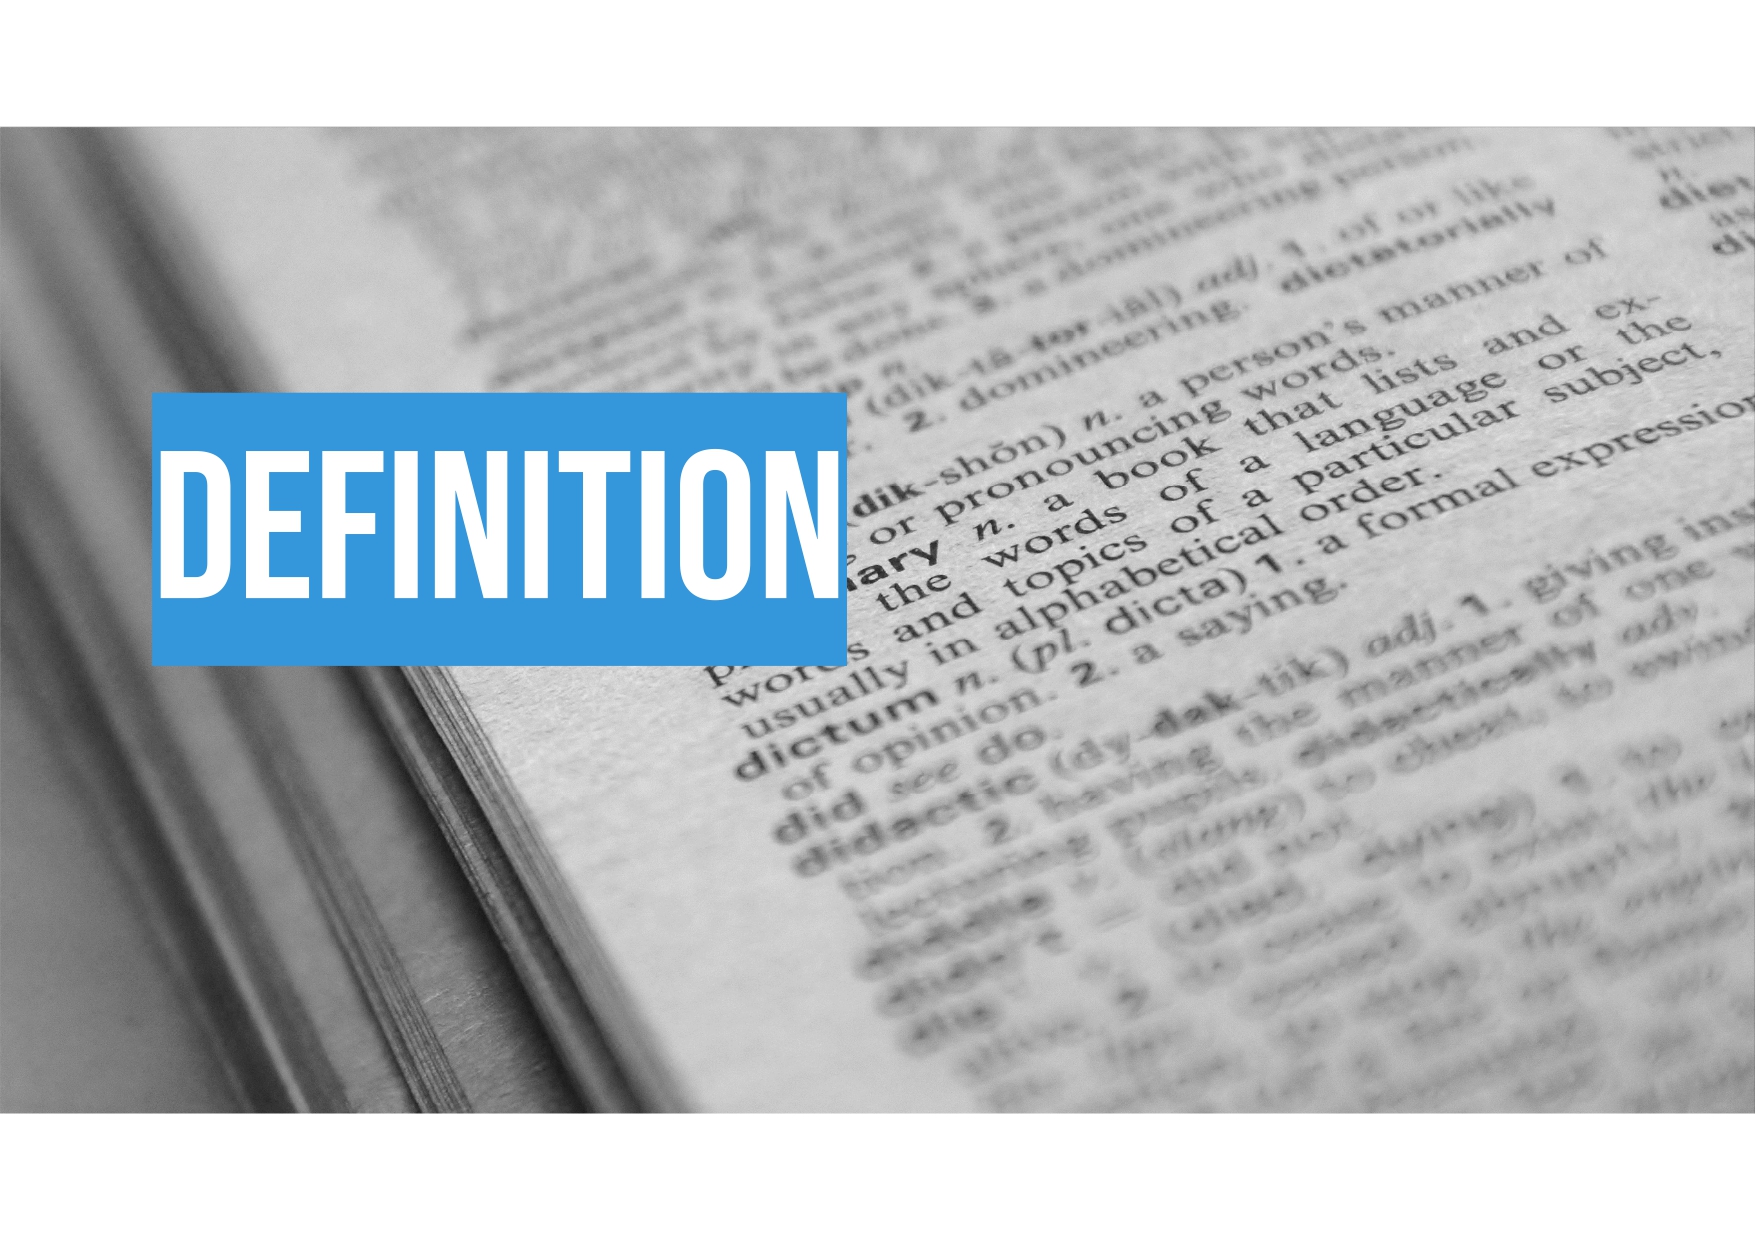
A close-up of a dictionary open to a page showing the word "definition" in bold blue text over the page.
ai ppt.
ai definition ppt.
A dark background with the word "Infographics" in white text on the left and a bar graph on the right showing four triangles in blue, yellow, red, and green with numbers 3.6, 6.6, 9.7, and 4.1 respectively.
ai data ppt.
ai market value.
ai global statistics.
Bar chart showing ai global corporate investment from 2015 to 2022, highlighting a 7x increase, peaking at 94 billion dollars in 2021.
Bar chart showing global ai spending in 2023 by industry, with 'other' at 72 billion dollars, followed by manufacturing, banking, and services.
Bar chart showing global spending by industry in 2023: other 47%, manufacturing 17%, banking 13%, retail 10%, services 10%. footer cites idc.com.
leading countries in ai.
government ai readiness index score.
ai government strategy score.
ai operating environment score.
ai research capacity score.
ai impacts.
Bar graph showing the impact of ai on business supply chains (2023-25) with percentages for asia pacific (48%), north america (45%), west europe (35%), and globally (44%).
Bar chart showing growth of interest in ai by companies from 2015 to 2023, with increasing values from 0.7 to 16.6.
ai machine learning data.
Bar chart showing the projected growth of the machine learning market from 2020 to 2030, indicating a 9x increase in value, sourced from statista.
Bar chart showing the projected growth and decline of the machine learning market value worldwide from 2021 to 2030, with a peak in 2021.
ai computer vision data.
Bar chart depicting the projected growth of the global computer vision market from 2021 to 2030, highlighting a 7x increase, sourced from statista.com.
Bar chart showing the projected computer vision market value growth from 2021 to 2030, with a peak at 109 in 2021 and a gradual decline to 9 by 2030.
ai robots data.
Bar graph showing ai robots market value from 2020 to 2030, indicating a 7x growth by 2030, with values in billion dollars, sourced from statista.com.
Bar chart showing projected growth in ai robots market value worldwide from 2021 to 2030, with percentages increasing from 33% in 2021 up to 60% in 2024 then gradually decreasing to 5% by 2030.
ai natural language processing (nlp) data.
Bar chart showing ai nlp market value growth from 2020 to 2030, with a highlighted 5x growth indicator, data from statista.
Bar graph showing ai nlp market value growth & outlook worldwide, projecting an increase from 2021 to 2030, with data sourced from statista.com.
autonomous ai data.
Bar chart showing the growth of the autonomous ai market value from $18 billion in 2020 to a projected $60 billion in 2030, indicating a 3x growth.
Bar chart depicting the projected decline in the worldwide market value growth of autonomous ai from 81.0% in 2021 to 11.4% by 2030, sourced from statista.
Text logo saying "generative ai worldwide" in bold, white font on a dark gray background.
Bar chart displaying the generative ai market value from 2020 to 2030, showing significant growth with a 35% increase highlighted.
Bar chart depicting the projected market value growth of generative ai worldwide from 2021 to 2030, showing a peak in 2022 followed by a gradual decline.
generative ai ppt.
THANK YOU" text on a background of orange, geometric, folded paper with credit given to Dr. Salem Baidas.
A logo featuring a blue lightning bolt symbol next to the text "S2ADesign.com" in white, set against a dark gray background.
error: Content is protected !!